


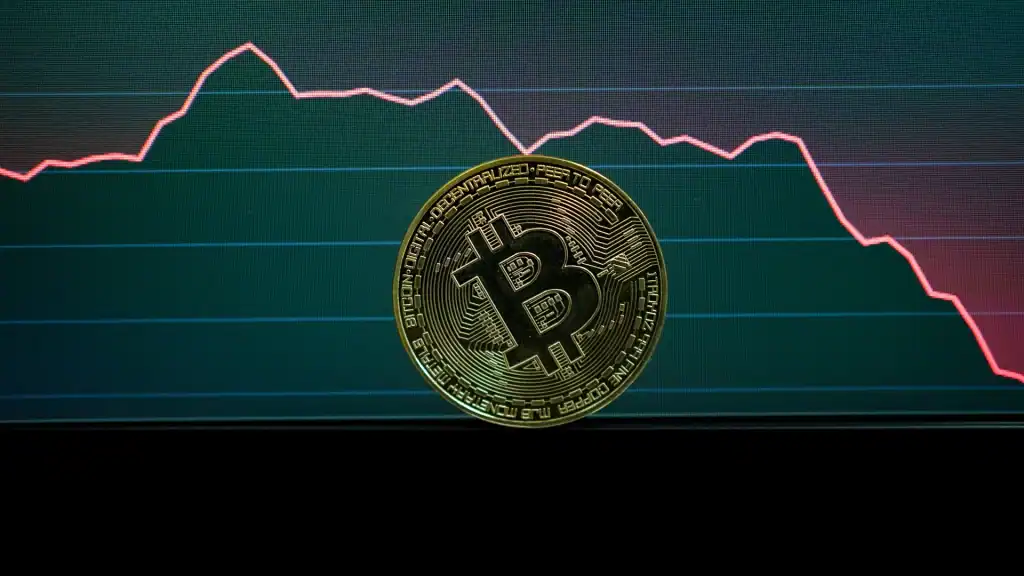
Bitcoin has broken decisively through a critical resistance zone as institutional demand accelerates. Major asset managers including BlackRock, Fidelity, and Franklin Templeton continue expanding their Bitcoin holdings, while on-chain metrics reveal that whales accumulated over 50,000 BTC in the past 30 days. The confluence of supply tightening and institutional absorption is driving sustained upward pressure.
This breakout signals a potential shift into price discovery, where Bitcoin could target new all-time highs in the coming weeks.
Key Takeaways
- Bitcoin has broken through key resistance near all-time highs, signaling strong bullish momentum.
- Institutional accumulation surged with whales adding over 50,000 BTC in the past 30 days.
- Exchange reserves have fallen to multi-year lows, historically a bullish supply signal.
- Major asset managers like BlackRock and Fidelity continue expanding Bitcoin allocations.
- Analysts target the next resistance zone with significant upside potential if macro conditions hold.
What Triggered the Bitcoin Breakout
The breakout didn’t happen in isolation. A combination of macro catalysts, spot ETF inflows, and declining exchange reserves created the conditions for Bitcoin to push through resistance that had capped prices for weeks.
Institutional Flows Reach Record Levels
Spot Bitcoin ETFs have recorded multi-billion dollar weekly inflows as institutional investors allocate to crypto exposure. BlackRock’s IBIT has become one of the fastest-growing ETFs in history, crossing major AUM milestones in record time.
Declining Exchange Reserves
Exchange Bitcoin reserves have fallen to their lowest levels in years. Coins moving off exchanges into cold storage historically indicates long-term holder conviction and reduces near-term selling pressure.
💡 Tip:When exchange reserves decline while prices rise, it signals a supply squeeze, one of the most reliable bullish setups in crypto markets.
Key Technical Levels After the Breakout
Technical analysts are watching several critical price levels following the resistance break.
| Level Type | Price Zone | Significance |
|---|---|---|
| New Support | Prior resistance level | Breakout retest, must hold |
| Near-term Target | +15 to 20% from breakout | Fib extension confluence |
| Major Target | Previous all-time high | Psychological + liquidity |
| Invalidation | Below breakout candle | Failed breakout signal |
Why Institutional Demand Matters More Now
Institutional demand differs fundamentally from retail speculation. Asset managers deploy capital with multi-year horizons, conduct rigorous due diligence, and rarely sell on short-term volatility.
ETF Absorption Outpaces Mining Supply
U.S. spot Bitcoin ETFs have absorbed more Bitcoin than miners produce on most trading days. This creates a structural supply deficit that pushes prices upward regardless of retail sentiment.
Corporate Treasuries Double Down
Public companies continue adding Bitcoin to their balance sheets. MicroStrategy’s aggressive accumulation strategy has been widely copied, turning corporate treasuries into a new source of persistent demand.
⚠️ Warning:Breakouts can reverse. Wait for confirmation through follow-through buying and successful retests before assuming the trend has fully shifted.
What Could Derail the Rally
No rally moves straight up. Several factors could cause Bitcoin to pull back after this breakout.
- Profit taking:Traders who bought at lower levels may take profits near psychological resistance
- Macro surprises:Unexpected Fed tightening or inflation spikes could trigger risk-off flows
- ETF outflows:A reversal of institutional inflows would remove the primary demand driver
- Regulatory shocks:Negative regulatory developments in key markets
- Exchange issues:Any major centralized exchange problem creates contagion risk
📌 Note:This article is informational and not financial advice. Always manage risk with proper position sizing and never invest more than you can afford to lose.
What Comes Next for Bitcoin
With the breakout confirmed and institutional flows intact, Bitcoin’s path of least resistance appears to be higher. However, cycle patterns suggest the most significant price discovery typically occurs during the later stages of the cycle, with multiple corrections along the way.
For investors, the key is maintaining a long-term perspective while managing position sizes appropriately. Bitcoin’s volatility cuts both ways, and even the strongest bull markets see 20-30% drawdowns that can shake out used positions.


50k BTC accumulated by whales in 30 days is the number that actually matters here, but I’d want to see that cross referenced with exchange netflows before calling it a genuine supply squeeze. Are those whale wallets cold storage or OTC desks parking inventory?
institutional demand narrative gets recycled every cycle top. BlackRock and Fidelity buying doesn’t mean retail exit liquidity isn’t being built right now. where’s the data on ETF outflows during the last correction?
been through 2013, 2017, and 2021. the ‘price discovery’ language always shows up right before the final leg, and also right before a 30% flush. both can be true at once.
exchange reserves at multi year lows is the quiet bullish signal nobody talks about