










































What to Know
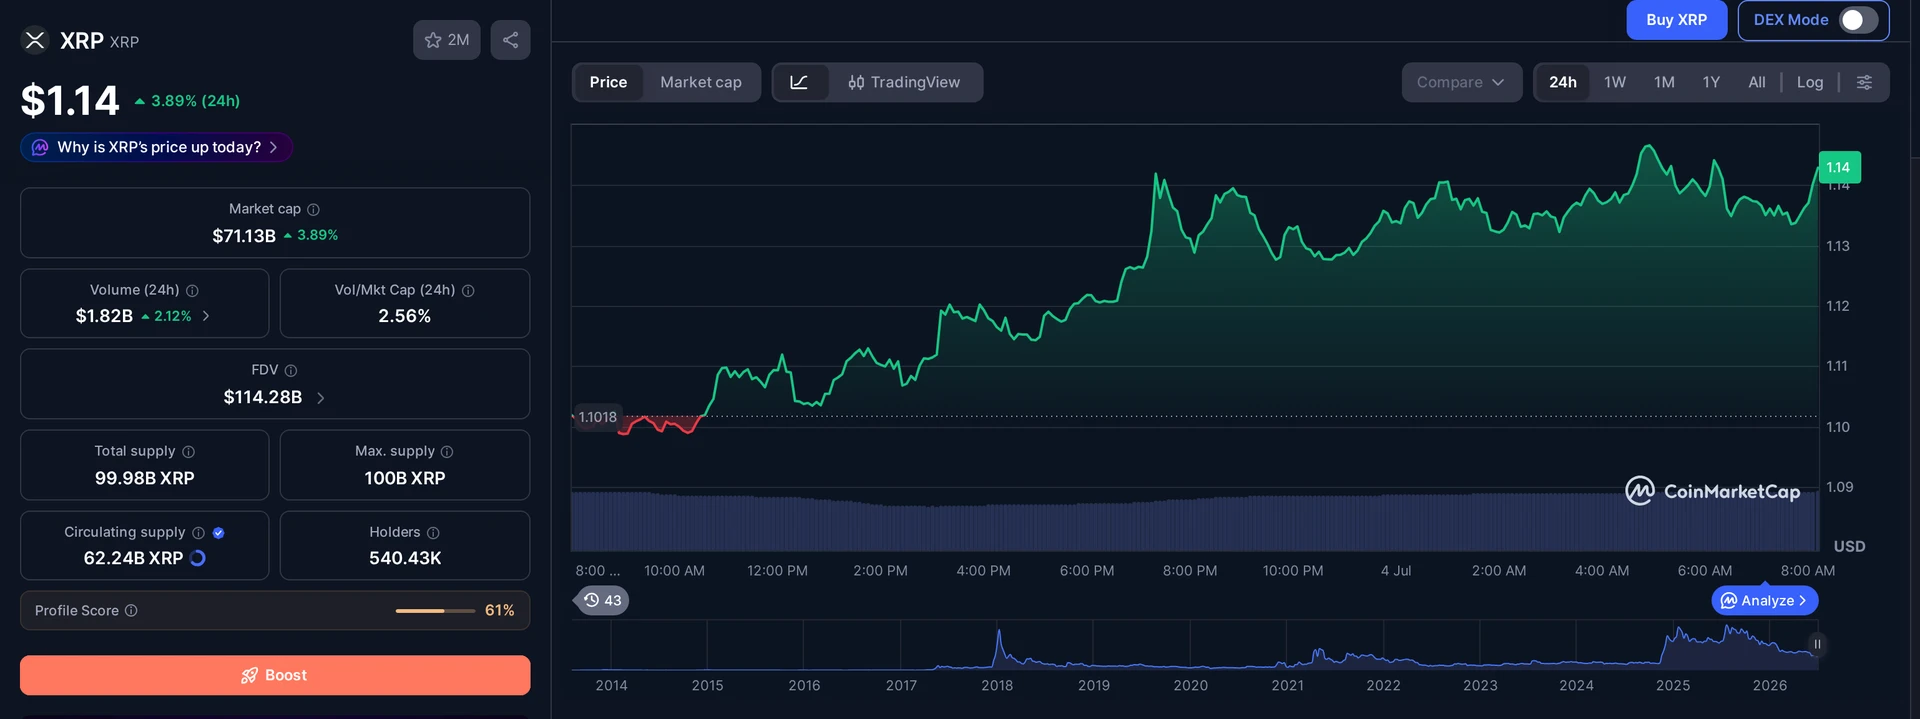
- XRP price has climbed about 8% over the past seven days to trade near $1.14
- XRP’s 30-day holder loss reading sits near -45% and the 365-day version near -47%, the deepest combined pain in the token’s roughly 12-year history
- Analytics firm Santiment flagged the reading in a Friday post, calling it a favorable risk-reward point rather than a price prediction
- Large bitcoin wallets have kept buying through record ETF outflows, a pattern that has historically shown up near cycle lows
XRP price climbs 8% this week even as XRP holders sit on the deepest average losses in the token’s history. XRP is up about 8% over seven days to trade near $1.14, while onchain data shows the typical holder is carrying a bigger paper loss than at any point since XRP launched roughly 12 years ago. That mix of red portfolios and green candles is exactly the setup some traders watch for when they hunt for a bottom, and it is worth unpacking why.
Why XRP Price Climbs 8% While Holders Sit Underwater?
XRP jumped 8% in a week even as holders stayed underwater
Sellers appear tapped out. XRP price climbs 8% to $1.14 over the past seven days, making the token one of the stronger performers among the week’s biggest coins, according to CoinMarketCap data. The rally happened while the average XRP holder was still nursing paper losses, an unusual mix analysts tend to notice closely.
Price and holder pain do not always move together. When a token is climbing, the assumption is usually that people who bought recently are sitting on gains. XRP flipped that script this week. Buyers pushed the price higher even as the broader base of holders remained deep in the red, a split that traders reading onchain data say points to fresh demand absorbing coins from exhausted sellers rather than late buyers chasing a top.
That distinction matters for anyone trying to read the tape. A rally built on new money chasing momentum tends to be fragile, since those buyers have thin conviction and sell fast at the first sign of trouble. A rally that shows up while existing holders are still underwater looks different, because it implies the people selling into strength are folks who have already given up on their position, not fresh buyers cashing out gains. That is the kind of price action analysts watch for when they try to separate a genuine shift in supply and demand from a short-lived bounce.
How Deep Are XRP Holder Losses Right Now?
XRP’s holder losses are the worst on record when measured across both short-term and long-term buyers combined. The reading comes from a ratio that compares XRP’s current price against the average price at which its coins last changed hands. When that number sits below zero, it means the typical holder paid more than the coin is worth today, and the deeper the negative number, the more widespread and severe the paper losses across the supply.
XRP’s 30-day reading is running around -45%, and the 365-day version is close to -47%, meaning both recent buyers and people who have held for a full year are underwater by roughly similar amounts. Combined, those two figures mark the lowest point in XRP’s history, according to XRP MVRV falls to 12-year low, an onchain analysis published by Santiment on Friday. In plain terms, more of the XRP supply is sitting on a loss right now than at any prior stretch since the token launched roughly 12 years ago.
That kind of reading usually shows up during what analysts call capitulation. Holders who bought at higher prices grow tired of watching their position bleed and eventually sell, often at a loss, handing their coins to buyers willing to take the other side of the trade. Once that selling pressure runs its course, there is simply less supply left that wants out, which can set the stage for a price recovery even if nothing else about the news backdrop has changed.
It helps to picture what this looks like across the full holder base rather than just one number. Someone who bought XRP a year ago is down roughly 47% on average, and someone who bought a month ago is down roughly 45% on average. Both groups are feeling similar pain despite buying at very different times, which tells analysts the losses are broad rather than limited to one narrow batch of late buyers who got caught at a local top.
The best setups often appear when the crowd is feeling maximum pain.
Why Analysts Call This a Risk-Reward Signal, Not a Price Call
Santiment was careful to frame the reading as a description of positioning, not a forecast. The firm’s argument is that so much downside has already been absorbed by existing holders that adding exposure at current levels carries less risk than it would after a long uptrend, when latecomers are usually the ones holding the bag. That does not mean the price cannot fall further. Santiment itself noted that losses can deepen if the broader crypto market weakens, and a washed-out reading can stay washed out for a long stretch rather than snapping back immediately.
It is worth being precise about what this kind of onchain gauge actually measures. It tracks how much pain existing holders are carrying, not when that pain flips into a recovery. Stretched losses can persist through sideways chop or even another leg lower, so traders watching this signal are really tracking whether sellers have exhausted themselves, not predicting a specific bottom price or date. The gauge answers one question, whether selling pressure from underwater holders looks largely spent, and leaves the timing question open.
That gap between description and prediction is exactly where a lot of onchain analysis gets misread. A record-low reading does not mean XRP bounces tomorrow, next week, or even next month. It means the pool of holders who are desperate enough to sell at a loss has shrunk to historically small levels, which is a different claim than saying demand is about to overwhelm supply. Traders who confuse the two often end up disappointed when a washed-out market keeps grinding sideways for longer than they expected.
What Does the Bitcoin Whale Pattern Add to the Picture?
XRP’s setup is not happening in isolation. Large bitcoin wallets have been quietly accumulating even as spot ETFs saw record outflows, according to bitcoin whale accumulation amid record ETF outflows data cited by onchain analysts. That combination, big holders buying while retail-facing products bleed, is the same capitulation-and-absorption pattern showing up in XRP’s holder-loss data, and historically it has tended to form closer to cycle lows than cycle tops.
Seeing the same pattern in two of the market’s largest tokens adds some weight to the read. It is one thing for a single coin to flash a record-low holder-loss reading. It is another for that signal to line up with bitcoin whales stepping in while everyday ETF investors are heading for the exits. Neither pattern alone proves anything, but together they paint a picture of larger, more patient money absorbing supply from smaller, more panicked sellers across more than one corner of the market.
None of this guarantees XRP has actually bottomed. Markets can stay irrational and losses can stretch out for months. But the alignment between XRP’s record holder pain and bitcoin’s whale accumulation gives traders watching both charts a reason to pay closer attention to whether buyers keep stepping in on dips, rather than assume the worst is still ahead. For now, the message from the data is fairly narrow: selling pressure looks tired, not that a rally is guaranteed.
Frequently Asked Questions
Why did XRP price climb 8% this week?
XRP rose about 8% over seven days to roughly $1.14 even as most holders remained underwater on paper. Analysts point to exhausted selling pressure from long-underwater holders as fresh buyers absorbed available supply, a pattern often seen near market bottoms rather than at tops.
What does it mean when XRP holders are underwater?
It means the average holder paid more for XRP than it is currently worth. Santiment’s data shows XRP’s 30-day and 365-day loss readings near -45% and -47%, the deepest combined losses in the token’s roughly 12-year history, based on average purchase prices across the supply.
Does record holder pain mean XRP has bottomed?
Not necessarily. The reading shows how washed out current positioning is, not when a reversal happens. Santiment cautioned that losses could deepen further if the broader crypto market weakens, so the signal points to reduced risk, not a confirmed bottom.
How does XRP's setup compare to bitcoin right now?
Both show signs of capitulation and absorption. Large bitcoin wallets have kept buying through record ETF outflows while XRP holders sit on record losses, a pairing that has historically appeared closer to cycle lows than cycle tops, according to onchain analysts tracking both assets.
This article is for informational purposes only and does not constitute investment advice. Every investment and trading decision involves risk. Readers should conduct their own research before making any financial decisions.


















holder loss capitulation lining up with an 8% bounce is textbook, but I’d want to see spot volume confirm before calling a real bottom on XRP
bottom calls every time price bumps 8%, wake me when it reclaims 1.50
12-year low on realized losses is wild if accurate. what onchain source is that pulled from, Glassnode or Santiment?