











































What to Know
- $78,670, the weekly close level BTC needs to exceed for its highest candle since late January 2026
- $630 million in spot Bitcoin ETF net inflows recorded on Friday May 1, 2026, with BlackRock IBIT leading at $284M
- US President Trump called Iran’s latest peace proposals unacceptable, injecting fresh uncertainty into risk markets
- Traders are flagging a liquidity trap above current prices, fresh longs building into highs with limited follow-through buying
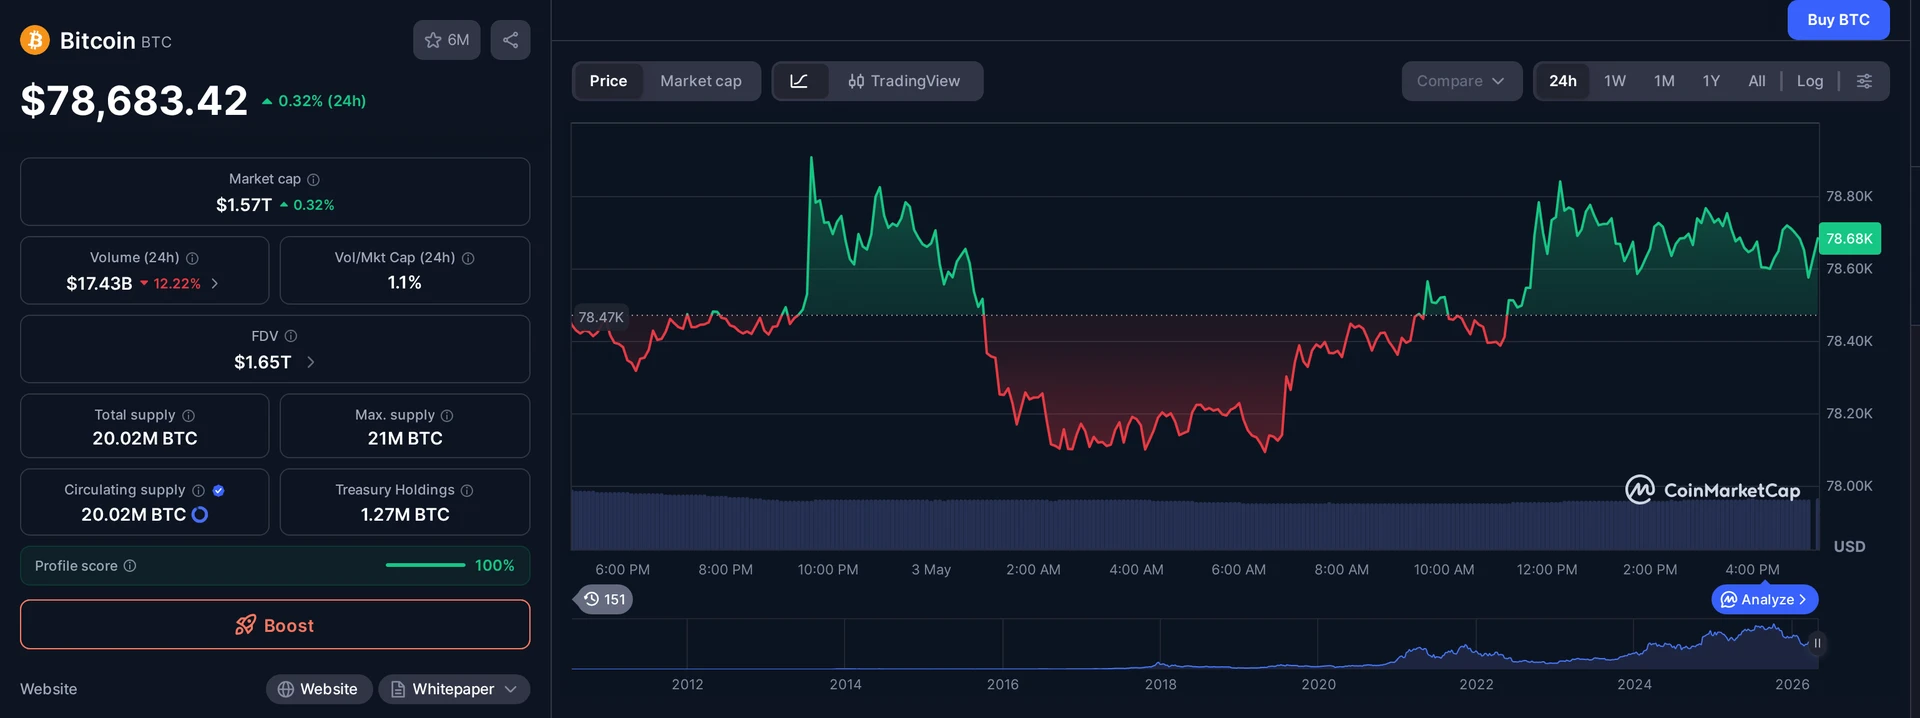
The Bitcoin highest weekly close since January 2026 is suddenly in play, with BTC/USD spending Sunday hovering near $79,000 and attempting to lock in gains after a bruising mid-week stretch that had bears convinced the rally was over. It wasn’t, not yet, anyway.
What Would the Bitcoin Highest Weekly Close Since January 2026 Mean?
A weekly close above $78,670 would give Bitcoin its strongest candle finish since late January 2026, and that matters more than the raw price level. Weekly closes are the benchmark traders, funds, and on-chain analysts use to gauge trend health. A clean weekly close above that level is a different conversation entirely.
According to Bitcoin historical price data, BTC last posted a comparable weekly close in the final days of January 2026, before the Q1 consolidation dragged prices back toward the mid-$60,000s. Recovering that territory now, after months of sideways grind, would hand bulls a technical argument that the broader uptrend is resuming rather than topping out.
The setup going into Sunday’s candle wasn’t clean. Intraday charts showed classic absorption behavior: aggressive market buying met steady selling near the highs, price unable to push through resistance despite multiple attempts. That kind of action often resolves downward before it resolves upward. Still, the weekly candle was holding, and as long as it held, bulls kept the argument alive.
How Did $630M in Spot ETF Inflows Change the Market Setup?
Friday’s session was the pivot. Spot Bitcoin ETF inflows totaling nearly $630 million flooded into US-listed products on May 1, 2026, a single-day number that arrived mid-week when sentiment was still fragile from earlier losses. BlackRock‘s IBIT led individual products at roughly $284 million, with the rest distributed across competing ETF issuers.
Trader and analyst Michaël van de Poppe cited these flows directly when making his bullish case on X. He described the post-Friday price action as a “relatively shallow consolidation”, meaning buyers absorbed the selling pressure without flinching. He doesn’t expect institutional demand to slow in the week ahead, and the inflow number gives that view a concrete foundation.
That read isn’t unreasonable. When $630 million enters a market in a single session, it creates a real demand floor, at least temporarily. Whether that floor holds through a full weekly candle is a separate question, but the data gave bulls something tangible to point at when defending the bull case against skeptics.
What makes this week’s ETF number interesting is the context: flows had been choppy for weeks heading into May. A single outsized day doesn’t reverse a trend, but it does shift positioning. Funds that missed the initial Friday move had fresh motivation to participate before the weekly close.
I don’t think this will slow down in the coming week and that’s probably why we’re seeing a relatively shallow consolidation taking place.
Trump, Iran, and the Geopolitical Wildcard Hanging Over Bitcoin
Risk assets caught a bid on Friday when optimism about a US-Iran peace deal started circulating. Crypto followed equities higher. Then Sunday delivered a reality check.
On Truth Social, US President Donald Trump threw cold water on the diplomatic narrative, saying he “can’t imagine” that Iran’s latest proposals would be acceptable. That is not a negotiating posture, that is a door closing. Trump’s skepticism toward Iran’s peace proposals signaled clearly that the geopolitical uncertainty driving macro volatility wasn’t resolving anytime soon.
For crypto traders, the Iran situation creates a genuinely awkward read. Persistent conflict suppresses institutional risk appetite, bad for BTC bulls hoping for fresh capital rotation into hard assets. But prolonged dollar uncertainty and geopolitical instability have historically been cited as arguments for Bitcoin as a store of value, which some analysts lean on in exactly this kind of environment.
The problem is neither narrative moves markets cleanly when BTC is trading in a narrow band just below key resistance. The same headline that lifts the Nasdaq on Friday afternoon can reverse Bitcoin’s weekly candle gains before Sunday’s close. That’s the macro environment right now, and pretending otherwise is wishful thinking.
I can’t imagine that it would be acceptable.
Liquidity Traps and Why the Bears Had a Case Too
Not everyone was buying the bullish script. Crypto Tony flagged a troubling pattern on CoinGlass data Sunday: liquidity building below current prices while high-side liquidity was being primed for a sweep-and-dump. “Starting to see a build of liquidity form below, but a take of the high liquidity and using that to dump,” he posted, a textbook description of a stop-hunt setup playing out above market.
Trading account JDK Analysis put it more bluntly. Fresh longs were opening into the highs while price kept showing absorption, unable to push meaningfully through resistance despite buyers repeatedly throwing bids at the level. They described the setup as “typically bearish,” which isn’t a hot take so much as a pattern recognition call based on 15-minute chart structure.
Here’s the uncomfortable truth: both the bull and bear narratives were live simultaneously heading into the close. $630 million in ETF inflows creates genuine demand. A liquidity trap above key resistance creates genuine risk. These things don’t cancel each other out, they coexist right up until the weekly candle prints, at which point one of them is right and one of them isn’t.
Van de Poppe was betting the ETF flows meant the path of least resistance was up. The CoinGlass crowd was betting the liquidity structure meant a shakeout was coming. The weekly candle would tell both sides which read was correct.
We can clearly see fresh longs opening into the highs, while price continues to show signs of absorption, unable to push meaningfully higher despite increasingly aggressive market buying for now.
Frequently Asked Questions
What is Bitcoin's highest weekly close since January 2026?
Bitcoin last posted a comparable weekly close in the final days of January 2026. A close above $78,670 on Sunday, May 3, 2026 would mark the highest weekly close since that period, giving bulls a technical argument that the Q1 downtrend has reversed and a fresh uptrend is underway.
How large were spot Bitcoin ETF inflows on May 1, 2026?
US-listed spot Bitcoin ETFs recorded nearly $630 million in net inflows on Friday, May 1, 2026. BlackRock’s IBIT led individual products with approximately $284 million. Analysts cited the figure as a key factor supporting price stability and bullish sentiment into Sunday’s weekly close.
Why are Trump's comments on Iran affecting Bitcoin prices?
Crypto markets have grown tightly correlated with US macro risk sentiment. Friday’s rally in risk assets was partly driven by optimism over a potential US-Iran peace deal. Trump’s Sunday statement calling Iran’s proposals unacceptable on Truth Social reversed that optimism, creating headwinds for BTC near a critical weekly close level.
What is a liquidity trap in Bitcoin trading?
A liquidity trap is a setup where price moves toward a cluster of resting orders, typically stop-losses or buy triggers, triggers them, then reverses sharply. Traders Crypto Tony and JDK Analysis identified this pattern developing above current BTC prices heading into the May 3 weekly candle close on CoinGlass data.
This article is for informational purposes only and does not constitute investment advice. Every investment and trading decision involves risk. Readers should conduct their own research before making any financial decisions.


















$630M in a single day on May 1 is the kind of print that flips short-term sentiment fast, but I’d want to see if it’s mostly IBIT again or if Fidelity and Bitwise are catching up before calling it real broad demand.
weekly close above 78,670 means almost nothing if spot volume keeps fading on the way up
Been here since 2017 and these post-halving consolidations always feel boring until the candle that breaks them. January high reclaim usually front-runs the next leg, not the other way around.
anyone know how much of the $630M was IBIT vs the smaller issuers? curious if the concentration is getting worse
Skeptical of framing this as a breakout when we’re still under the Jan 26 high. A weekly close near 79K is fine but funding rates are already heating up and that rarely ends quietly.
near 79k feels good but i’ll believe it after the friday close prints