











































What to Know
- Bitcoin traded near $65,245 on Tuesday, up 5.02% over the past week.
- U.S. spot Bitcoin ETFs added $226.9 million on Monday, a fifth straight day of inflows.
- Large wallets accumulated about 270,000 BTC worth roughly $16.7 billion during the recent outflow period.
- Alphractal’s onchain model flags Bitcoin as undervalued, with BTC still 48% below its 2025 peak of $126,000.
Bitcoin price rebound above $65,000 accelerated on Tuesday as steady ETF inflows and returning risk appetite lifted the token 5% over the past seven days. The move followed a rough week for tech stocks and a matching dip in crypto prices, but buyers stepped back in fast once Asian markets turned green again.
Bitcoin Price Rebounds Above $65,000 as Asian Tech Stocks Recover
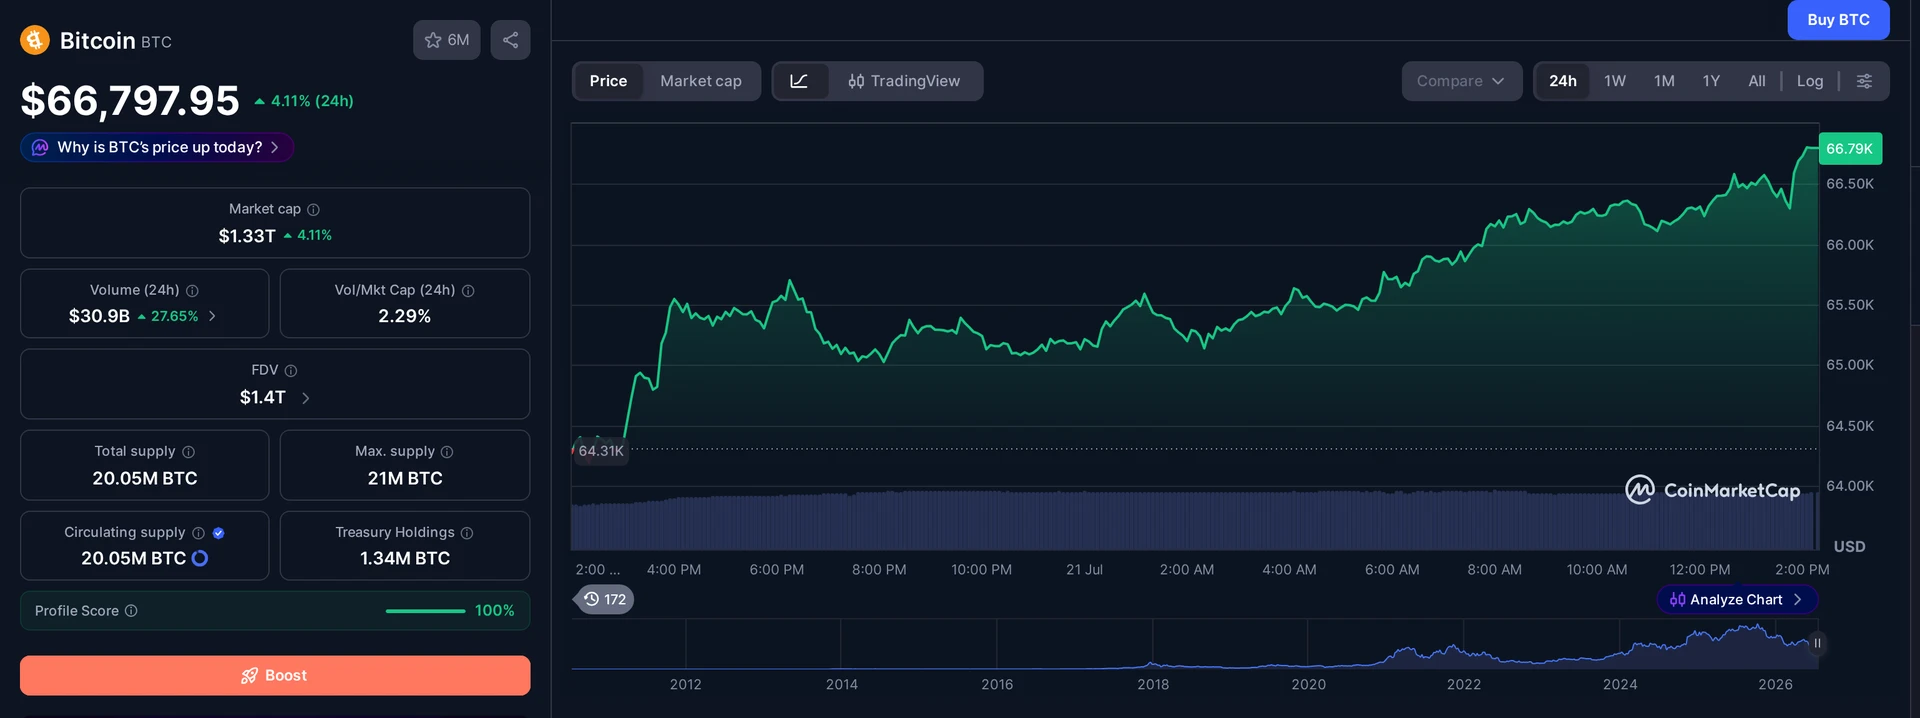
BTC traded around $65,245 on Tuesday, according to market data, up 1.23% over 24 hours and 5.02% over the past week. Trading volume across exchanges reached roughly $32.18 billion. Other major tokens moved higher too. Ethereum traded near $1,901, XRP sat around $1.11, Solana held near $77.73, BNB traded close to $571, and Hyperliquid was near $62.49. Dogecoin traded around $0.073.
The rally tracked a sharp reversal in Asian equities, with South Korea’s Kospi jumping 4.7%, Japan’s Nikkei rising 2.8%, and Taiwan’s Taiex gaining 3.6%, marking one of the strongest single-day recoveries the region had seen since the start of the tech-driven selloff the week before. Semiconductor and AI stocks, the same group that triggered last week’s selloff over fresh Chinese competition worries, led the bounce back. Samsung Electronics, SK Hynix, and Taiwan Semiconductor all recovered alongside the broader market. Bitcoin had dropped below $64,000 just days earlier as that selloff spread into crypto. This Bitcoin price rebound above $65,000 briefly pushed the token to its highest level in about two weeks, continuing a recovery that started near $58,000 to $60,000 in June.
Oil prices helped too. Brent crude slipped about 1% toward $88 a barrel after reports that mediators floated a 10-day ceasefire between the U.S. and Iran. Fighting hasn’t stopped and no deal is confirmed, but the drop in oil eased some of the pressure that had been building across risk assets over the prior two sessions.
Tuesday’s move also matters for sentiment. Bitcoin had spent the back half of last week under pressure, dragged lower alongside a tech selloff that had nothing to do with crypto fundamentals and everything to do with fears over Chinese AI competition. That kind of correlated selloff can rattle traders even when the underlying asset hasn’t changed. The fact that Bitcoin snapped back this fast, right alongside the same stocks that dragged it down, says the move lower was more about macro fear than a real shift in Bitcoin demand.
What Is Fueling the Bitcoin ETF Inflow Streak?
U.S. spot Bitcoin ETFs are pulling in fresh cash again after months of outflows. The funds took in $226.9 million in net inflows on Monday, according to data from Bitcoin ETF inflows $226.9 million tracker SoSoValue. That extended the inflow streak to five straight sessions, bringing the total added over that stretch to about $727.3 million.
That is a real shift. More than $4 billion left U.S. spot Bitcoin ETFs during June alone, and a brutal 13-session outflow streak between May and early June wiped out roughly $4.37 billion, a stretch bad enough that plenty of traders assumed institutional demand for Bitcoin had dried up completely. Five days of inflows doesn’t erase that damage, but it does suggest the selling pressure that dragged Bitcoin down for weeks may be losing steam.
Whether institutions keep adding through the rest of the week is the open question. ETF flows can flip fast, and one strong week doesn’t erase two months of redemptions. But five straight days of buying, right after the kind of outflow streak Bitcoin ETFs just went through, is the clearest sign yet that institutional selling pressure has eased. If flows stay positive into next week, that’s a meaningfully different story than the one investors were dealing with back in June.
Bitcoin Whales Keep Buying During the Dip
ETFs were not the only buyers quietly building positions. Large wallets added about 270,000 BTC, worth roughly $16.7 billion, during the same stretch when ETFs were bleeding cash, based on Bitcoin whale accumulation of 270,000 BTC tracking data.
That divergence matters. While ETF investors were heading for the exits in May and June, someone else was buying the dip in size. Call it conviction or call it opportunism, but whales don’t move 270,000 BTC on a whim. Now that ETF flows have flipped positive too, both sources of demand are pointing the same direction for the first time in weeks. That combination, institutional buyers and large holders both accumulating, is the kind of setup bulls have been waiting for since the June low.
History offers a rough guide here. Large holders tend to accumulate when prices look cheap relative to where the market has been, not when headlines are screaming bullish. The 270,000 BTC added during this stretch lines up with a period when sentiment was mostly negative and ETF investors were still heading for the door. That’s usually when the smart money is buying, not selling.
Alphractal Data Points to Bitcoin Undervaluation
Bitcoin may still be cheap by historical standards, according to crypto market intelligence platform Alphractal. Its Alphractal Bitcoin undervaluation model, a four-year standardized MVRV reading, flags any score below a Z-score of -1 as a period of severe historical undervaluation, the kind of window that has historically rewarded dollar-cost averaging.
MVRV compares Bitcoin’s market value to the price paid by holders when their coins last moved onchain. It’s not a short-term price predictor, and past patterns don’t guarantee future returns. Still, the metric adds context to where Bitcoin sits after tumbling from its 2025 record above $126,000. BTC currently trades about 48% below that peak, according to market data, which is a steep drawdown by any measure.
Alphractal isn’t the only source flagging this cycle position, but its MVRV Z-score approach gives traders a simple way to frame it. A reading below -1 doesn’t mean the bottom is guaranteed. It means, historically, Bitcoin hasn’t stayed this cheap relative to its four-year average for long. That’s a useful data point for anyone deciding whether to keep buying through the recovery or wait for more confirmation.
What Does the Bitcoin Chart Say Now?
Bitcoin’s daily chart backs up the recovery story with real momentum, not just hope. The MACD line sits near 464.37, above its signal line at about 93.55, and the histogram remains positive around 370.82. That’s a textbook bullish momentum setup.
The RSI tells a similar story. It’s near 60.07, above its own moving average of roughly 52.91 and comfortably above the neutral 50 line, though still short of overbought territory. Holding above $65,000 keeps the recovery structure intact. The next real test for buyers sits at $70,000. Clear that level and the June-to-July bounce starts looking like more than a dead cat relief rally. Fail to hold $65,000, and this whole rebound gets a lot less convincing fast.
What Does This Mean for Bitcoin Investors?
For anyone holding Bitcoin through the June drop, this week’s bounce is the first real relief in a while. The setup right now, ETF inflows returning, whales still accumulating, and onchain data flagging undervaluation, is about as clean a bullish alignment as this market has shown in months. That doesn’t mean the selloff is over for good. Semiconductor stocks could roll over again, oil could spike back up if the Iran ceasefire talks fall apart, and ETF flows could reverse just as fast as they turned positive. But for now, the pieces lining up favor buyers, not sellers.
Frequently Asked Questions
Why did Bitcoin's price jump 5% this week?
Bitcoin climbed 5% over seven days after Asian tech stocks rebounded from a semiconductor-driven selloff, pushing BTC back above $65,000 on Tuesday. Renewed demand for U.S. spot Bitcoin ETFs, which added $226.9 million on Monday and extended a five-session inflow streak, also supported the move alongside a broader rebound in South Korea, Japan, and Taiwan.
How much did Bitcoin ETFs take in during the inflow streak?
U.S. spot Bitcoin ETFs added about $727.3 million over five consecutive sessions, including $226.9 million on Monday alone, according to SoSoValue data. That followed heavy withdrawals earlier in the summer, including more than $4 billion in June and a separate 13-session outflow streak that removed roughly $4.37 billion between May and early June.
What does the Alphractal MVRV model say about Bitcoin's price?
Alphractal’s four-year standardized MVRV model treats a Z-score below -1 as a period of severe historical undervaluation. The firm says such readings have historically marked stronger windows for dollar-cost averaging into Bitcoin, though it isn’t a short-term price forecast and past patterns don’t guarantee future returns for investors.
What is Bitcoin's next resistance level after $65,000?
Bitcoin needs to hold above $65,000 to keep its current recovery structure intact, with $70,000 marking the next key resistance level. The daily chart’s MACD and RSI both show strengthening bullish momentum following the June lows near $58,000 to $60,000.
This article is for informational purposes only and does not constitute investment advice. Every investment and trading decision involves risk. Readers should conduct their own research before making any financial decisions.
















$226.9M in weekly inflows is decent but nowhere near the March peak when we saw over a billion in a single day. Curious if this pace sustains or fades by Friday.