











































What to Know
- $996 millionin net inflows hit spot Bitcoin ETFs last week, the strongest weekly performance since early January
- $663.9 millionpoured in on Friday alone, the single biggest day of the week, as geopolitical tensions eased
- Bitcoin surged above $77,000after Iran announced theStrait of Hormuzhad reopened to commercial shipping
- Total net assets across all spot Bitcoin ETF products climbed above$101 billionby week’s end
Spot Bitcoin ETFs just posted their best week in more than three months, pulling in$996 millionin net inflows as shifting geopolitical winds, and a dollar that keeps looking shakier, pushed institutional money back toward crypto. It is the kind of number that gets people talking again about whether the ETF honeymoon is back on.
The Weekly Breakdown: A Bumpy Road to $996 Million
Monday was rough. A$291 millionnet outflow kicked off the week on a sour note, the kind of start that makes portfolio managers nervous. Then things turned fast.Spot Bitcoin ETFsreversed hard,$411.5 millioncame in on Tuesday, followed by$186 millionon Wednesday and a quieter$26 millionon Thursday.
Friday is where the story really got interesting. A single-day haul of$663.9 millionmade it the strongest day of the week by a mile, and it did not happen in a vacuum. That Friday surge landed right alongside news that rattled global markets in a way nobody quite expected.
By the close of the week, total net assets sitting inside spot Bitcoin ETF products had crossed$101 billion. Daily trading volumes were tracking near$4.8 billiona sharp jump from the sluggish activity that defined much of March. Whether that volume holds is the real question.
What Actually Drove the Flows? Geopolitics and a Wobbling Dollar
Here is the angle most people glossed over: this is not purely a Bitcoin story. Analysts at Bitunix put it bluntly, markets have stopped worrying aboutwhethergeopolitical tensions exist and started pricing inhowthey evolve. There is a difference, and it matters for asset allocation.
The Federal Reserve is still dragging its feet on rate cuts, long-term US yields remain elevated, and cracks in confidence around US debt demand are widening. That combination has been quietly eating away at the dollar’s safe-haven appeal for weeks. When the dollar looks less reliable, alternative stores of value start looking a lot more attractive, and right now,Bitcoinsits at the top of that list for an increasing number of institutional allocators.
“In crypto market structure, BTC is currently in a classic liquidity redistribution phase,” Bitunix analysts wrote, noting that Bitcoin has been trading in a defined range with resistance sitting above$75,000and support forming near$72,000. “Liquidation heatmaps suggest the market is building a new equilibrium range rather than extending a directional trend,” they added.
Call it consolidation. Call it accumulation. Either way, big money was clearly using the week’s dip on Monday as a buying opportunity rather than an exit signal.
In crypto market structure, BTC is currently in a classic liquidity redistribution phase. Liquidation heatmaps suggest the market is building a new equilibrium range rather than extending a directional trend.
The Hormuz Factor: How an Oil Route Sent Bitcoin to $77K
On Friday, Iran’s foreign minister announced that the Strait of Hormuz had been reopened to commercial shipping for the duration of the current ceasefire, and US President Donald Trump quickly confirmed it. One of the world’s most critical oil transit chokepoints, responsible for roughly20%of global oil flow, was no longer a flash point.
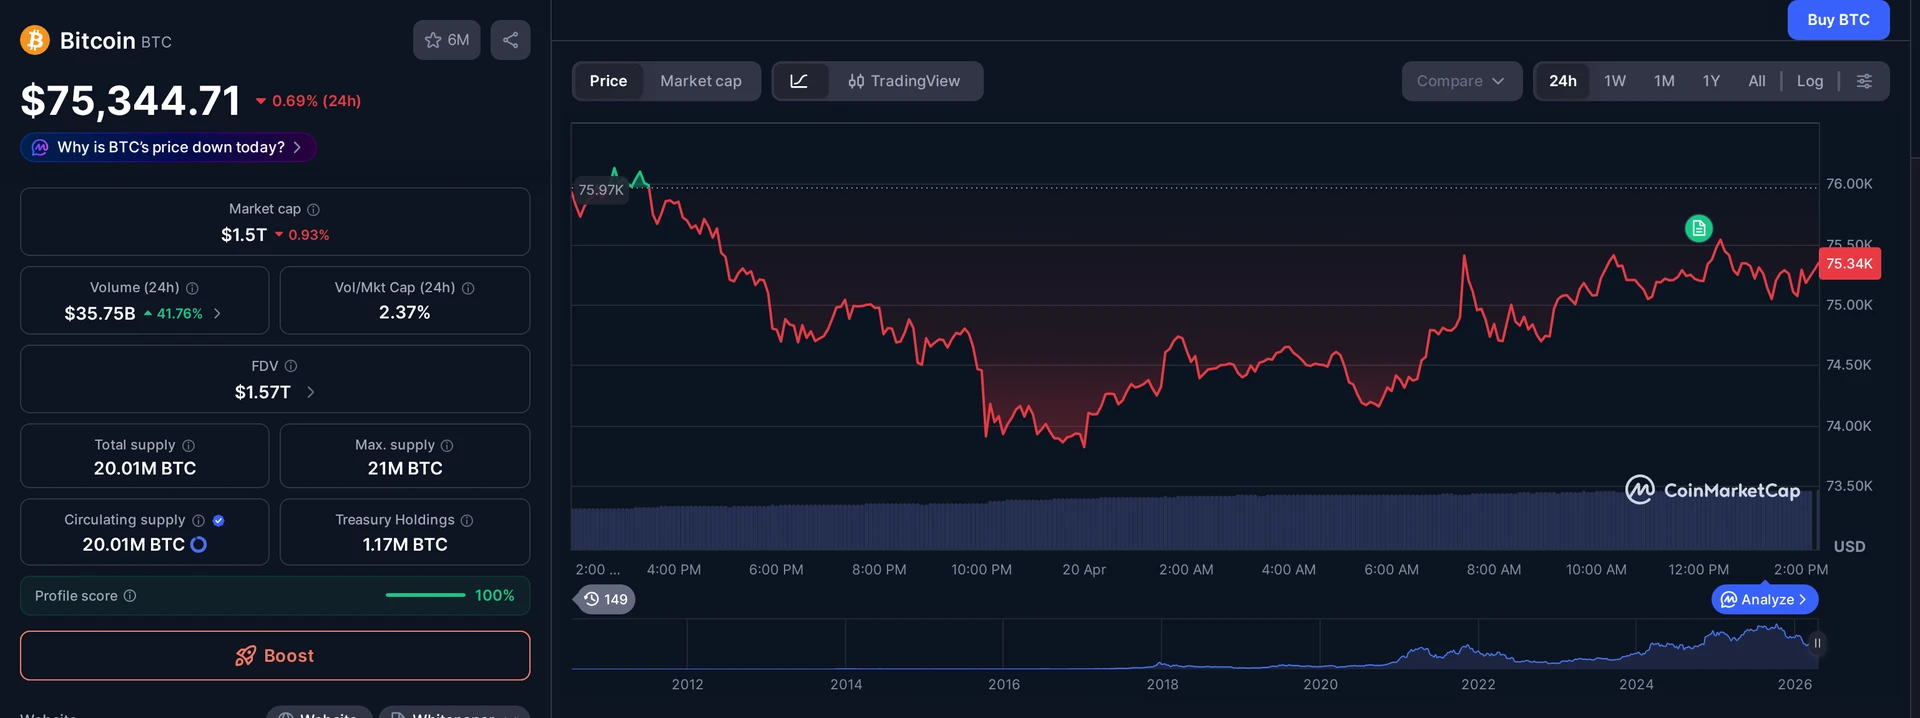
Oil markets reacted immediately. Brent crude dropped roughly10%to around$85 per barrel. Bitcoin, reading the same geopolitical tea leaves, did the opposite, it surged above$77,000adding to gains that had been building since Tuesday.
That inverse relationship between oil price spikes driven by conflict fear and Bitcoin inflows is worth paying attention to. When the extreme risk scenarios fade, money that was parked defensively starts looking for yield and growth again. Some of it goes back into equities. Some, increasingly, goes into spotspot Bitcoin ETFproducts sitting in standard brokerage accounts.
The Strait of Hormuz news acted like a pressure valve releasing. The immediate fear trade unwound, and the beneficiary was Bitcoin, not gold, not the yen. That tells you something about where institutional thinking is inApril 2026.
Signs of de-escalation, particularly around US, Iran relations, have reduced extreme risk scenarios, weakening demand for traditional safe havens like the US dollar.
Is This the Start of Another Spot Bitcoin ETFs Inflow Cycle?
The last time weekly inflows hit this range was early January, when$1.4 billionrolled into spot Bitcoin ETF products during a single week. That moment felt like a breakout. Then February and March turned into a slow grind of muted flows and sideways price action.
So is$996 millionthe reopening salvo or a one-week anomaly? Honest answer: too early to call. The macro setup, dollar weakness, geopolitical de-escalation, cautious Fed, is genuinely supportive. But the Bitunix team’s framing of a “liquidity redistribution phase” rather than a new directional trend is the more sober read, and probably the right one for now.
What is clear is that the infrastructure for institutional Bitcoin buying is now fully operational. The ETFs exist, the liquidity is there, and the flows respond to macro triggers faster than they ever did in the pre-ETF era. The $101 billion in total net assets did not appear overnight, it has been accumulating since approval in early 2024, and each macro catalyst seems to pull in a fresh tranche.
The question is not whether money will keep flowing into spot Bitcoin ETFs. It is what the next catalyst will be, and whether it will be as clean and definitive as a reopened oil route.
Frequently Asked Questions
How much did spot Bitcoin ETFs bring in last week?
Spot Bitcoin ETFs recorded $996 million in total net inflows for the week ending April 18, 2026, according to SoSoValue data. That is the highest weekly intake since early January, when inflows reached approximately $1.4 billion. Friday alone accounted for $663.9 million of that total.
Why did Bitcoin surge above $77,000 on Friday?
Bitcoin climbed above $77,000 after Iran’s foreign minister announced the Strait of Hormuz had been reopened to commercial shipping for the duration of the current ceasefire. US President Donald Trump confirmed the development. The easing of geopolitical tension reduced extreme risk scenarios and boosted appetite for alternative assets including Bitcoin.
What are analysts saying about Bitcoin's current price structure?
Analysts at Bitunix describe Bitcoin as being in a classic liquidity redistribution phase, trading with resistance above $75,000 and support near $72,000. They say liquidation heatmaps indicate the market is building a new equilibrium range rather than establishing a clear directional trend in either direction.
How much is currently held in spot Bitcoin ETFs?
Total net assets across all US spot Bitcoin ETF products climbed above $101 billion by the end of last week. Daily trading volumes approached $4.8 billion, a sharp increase from the subdued activity seen during most of March 2026, reflecting renewed institutional interest in the products.
This article is for informational purposes only and does not constitute investment advice. Every investment and trading decision involves risk. Readers should conduct their own research before making any financial decisions.


















$996M in a single week is serious, but worth noting most of that came from IBIT and FBTC alone. The smaller issuers are barely pulling flows. Concentration risk in the ETF basket is something nobody talks about.
ceasefire rally feels like a stretched narrative tbh. BTC was already grinding up before the Hormuz headlines hit the wire.
77k with institutional bid finally showing up again. January 2025 was the last time flows looked like this and we all know what happened after.
Inflows go brrr.
does anyone know if this $996M figure is net of GBTC outflows or gross across all eleven spot products? the reporting gets muddy week to week.
been around since the Mt Gox days and every cycle has its catalyst. 2017 had retail FOMO, 2021 had Tesla and Coinbase, now its the ETF plumbing doing the heavy lifting. different wrapper, same parabolic setup forming if history means anything.