











































What to Know
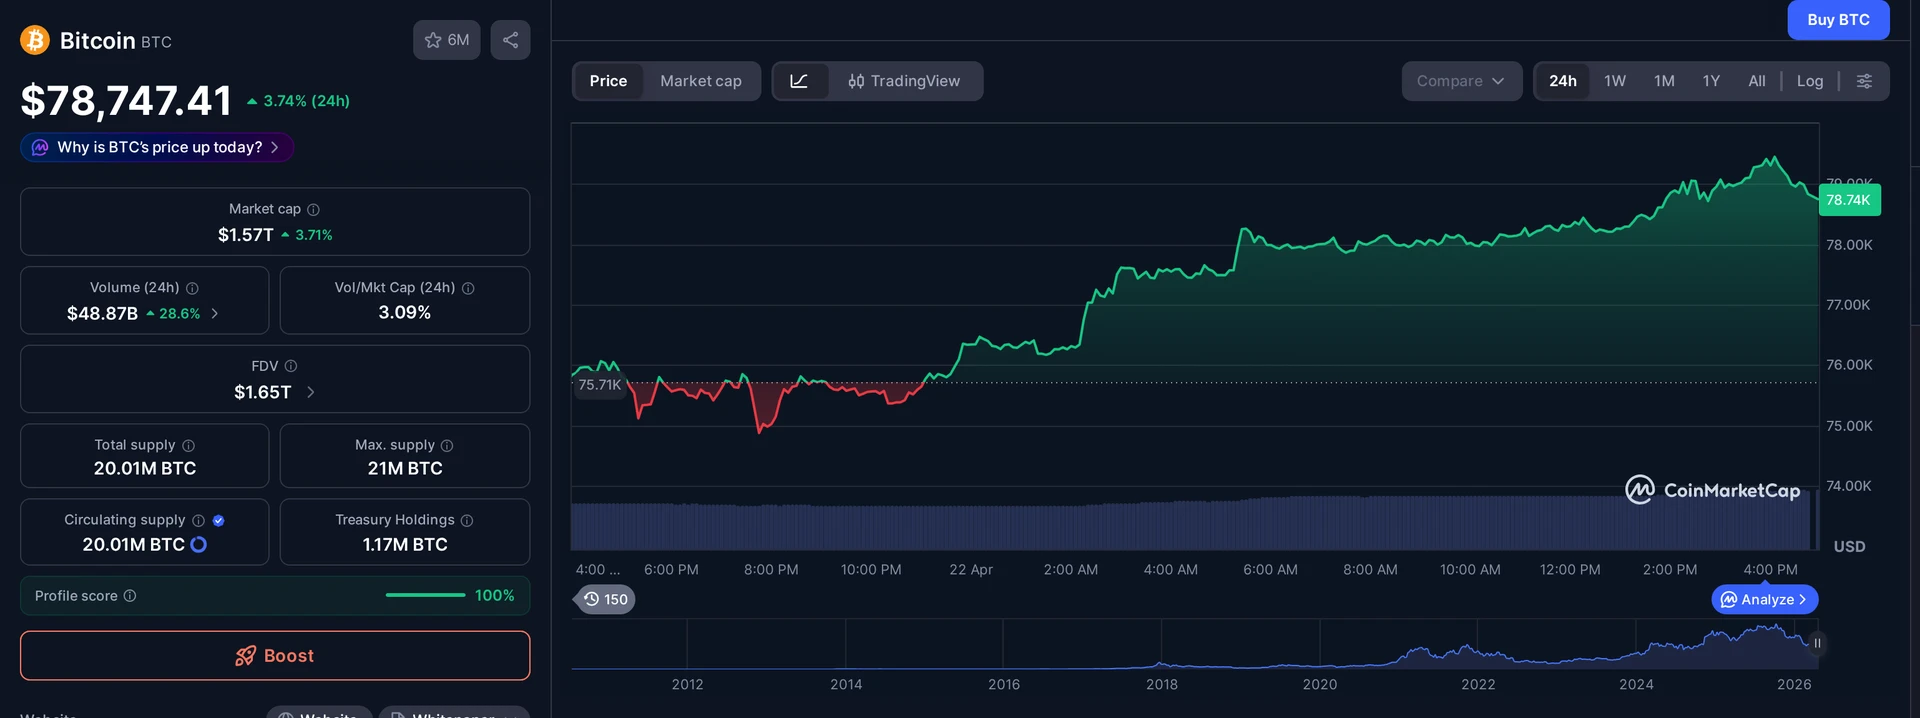
- Bitcoin cleared $76,000 resistance on April 22 with $76,500 now flipping into first support for bulls
- Spot ETFs pulled in $238 million on April 21 alone, the fifth straight day of net inflows
- Strategy’s 34,164 BTC purchase at $74,395 average sets $75,170 as the line that must hold
- Long-term holders sit on roughly 70% unrealized profit, with cost basis at $45,000 per coin
The bitcoin price prediction crowd has a new number to chase. BTC punched through $76,000 on April 22, 2026, and the move has every sell-side desk rewriting targets into the weekend. Price is up 1.5% in 24 hours. That is the fifth straight session of higher lows. The difference this time is who is buying. Retail is quiet. Institutions are not. Spot Bitcoin ETFs hoovered up $238 million on April 21, the fifth consecutive day of net inflows, and the tape reads like a coiled spring rather than a blow-off top.
Why Did Bitcoin Finally Clear $76,000?
The short answer: the sellers ran out of ammo. The $76,000 ceiling held through most of April, but each rejection came on lighter volume than the last. That is not strength. That is resistance bleeding out. Wednesday’s close above $76,500 arrived on expanding volume, which is the signal traders wait for. Bulls now treat that line as tactical support and are lining up for a run at $78,320, the recent swing high.
Flow explains the rest. According to Coinbase Institutional’s 2026 outlook, corporate treasury allocations have pushed past 4% of circulating BTC supply, a structural shift that did not exist in the last cycle. That buyer base does not flip on a 3% pullback. It adds.
The Three Levels Every Trader Is Watching
Sell-side desks have narrowed the bitcoin price prediction map to three specific prices into the weekend. Each one does a different job.
The one that matters most is $75,170. That is where Strategy’s purchase ledger sits on its most recent 34,164 BTC tranche at an average cost of $74,395. Lose that level on volume and the corporate-treasury bid gets tested for the first time in months.
- $75,170 critical support: the level Strategy’s 34,164 BTC average cost zone defends
- $76,500 tactical support: the flipped ceiling bulls need to hold on any retest
- $78,320 first resistance: a close above opens a clean path to $82,000
Who Is Actually Buying This Bitcoin Breakout?
Not you. Not your cousin. Not the guy on Twitter cycling through use. The buying is coming from balance sheets, and the single loudest one belongs to BlackRock’s IBIT fund, which absorbed $871 million across the past seven sessions. That is one issuer, one week, and the number dwarfs anything retail could manufacture on the other side.
Zoom out to the whole ETF complex and the story gets louder. Farside Investors’ ETF flow ledger pegs cumulative weekly inflows at $1.29 billion and still climbing. Five straight days of green. No distribution days. That cadence is what separates a real breakout from a bull trap, and it is the single most important variable for whether $78,320 falls this week or next.
The structural seller base that would need to pressure BTC lower simply is not present at $76,000.
The On-Chain Read Is Louder Than the Chart
Price action tells you what happened. On-chain data tells you who it happened to. Glassnode’s long-term holder realized price now sits at $45,000, which means the average wallet that has held BTC for more than 155 days is sitting on roughly 70% unrealized profit. That is a cohort with every incentive to stay put.
History is clear on what these holders do in a deep-profit regime. They do not dump into strength. They add on dips, they borrow against the stack to buy real estate or fund lifestyles, and they pass coins to heirs. The sell pressure that would snap this breakout has to come from somewhere else, and right now there is no obvious candidate.
What Happens If $75,170 Cracks?
Every clean bitcoin price prediction has to account for the downside, and this one is not complicated. A high-volume loss of $75,170 flips the short-term structure. From there, the next level is $73,221, the level where Strategy’s latest tranche moves into meaningful loss on paper. Below that the tape opens to $71,000, where the prior consolidation floor lives.
The sentiment read keeps this scenario in context rather than panic mode. The Fear and Greed Index is printing 29, which sits squarely in accumulation territory. Pullbacks that begin from fear-zone sentiment historically get absorbed faster than pullbacks that start from greed. This is not a market that is overextended. It is a market that is slowly being re-loaded from the bottom up.
The Path to $82,000 Is Narrower Than It Looks
Here is the honest take. The upside scenario only works if the flow cadence holds. ETF inflows have to stay positive through Friday. Strategy has to keep adding, or at minimum, stop disclosing sales. The macro overhang from the Iran ceasefire has to stay quiet. Miss any of those and the $78,320 test still happens, but the follow-through to $82,000 slips into early May rather than this week.
Bulls will take that trade. The tape belongs to them as long as $75,170 holds. Lose it and the entire prediction gets rewritten inside a single session. That is the nature of a breakout driven by flow rather than fundamentals: the signal is real, but the margin for error is thinner than the charts suggest.
One more thing to keep in mind. Breakouts in a fear-zone sentiment regime tend to be stealthier and more durable than breakouts that arrive with retail euphoria. There is no CNBC chyron here. No BTC hats. Just institutional tickets clearing in the background and a chart that looks cleaner than it has since March. That is usually how the serious legs start.
Frequently Asked Questions
What is the bitcoin price prediction for this week?
Bitcoin cleared $76,000 resistance on April 22, 2026, and now targets $78,320 as first resistance with $82,000 in play on a close above. Downside tests $75,170 critical support first. The path is flow-driven, with ETF inflows at $1.29 billion for the current week and Strategy still adding to its corporate treasury.
Why does $75,170 matter for Bitcoin right now?
$75,170 is the critical support level defended by Strategy’s most recent 34,164 BTC purchase at an average cost of $74,395. A high-volume loss of that level would flip the short-term structure, move Strategy’s tranche into meaningful loss, and open a path toward $73,221 and then $71,000.
How strong are Bitcoin ETF inflows in April 2026?
Spot Bitcoin ETFs absorbed $238 million on April 21 alone, the fifth straight day of net inflows, with cumulative weekly flows climbing past $1.29 billion. BlackRock’s iShares Bitcoin Trust led with $871 million across the past seven sessions, providing the institutional bid behind the $76,000 breakout.
What does the Fear and Greed Index at 29 mean for Bitcoin?
A reading of 29 places sentiment in the accumulation zone rather than the greed zone, signaling the market is not overextended. Pullbacks that start from fear-zone readings historically get absorbed rather than amplified, which supports the thesis that any retest of $75,170 would find buyers rather than cascade lower.
This article is for informational purposes only and does not constitute investment advice. Every investment and trading decision involves risk. Readers should conduct their own research before making any financial decisions.


















$76K clear looked clean on the daily but volume was underwhelming compared to the March push. Curious if anyone checked CVD on Coinbase spot because that’s usually where the real conviction shows up before a target like $78,320 gets hit.
ETF inflows at $1.29B sounds great until you remember last summer we had similar weeks right before a 12% flush. inflows are lagging indicators not leading ones.
finally broke out of that range, been sitting on spot since 71k and this is exactly the move i was waiting for
been through 2017, 2021, and the 2024 halving run. these round-number breakouts always feel inevitable in hindsight but the chop before $78K tends to shake out more longs than people expect.
what’s the derivatives funding looking like right now?
price target is fine but where’s the on-chain context. exchange balances, miner flows, long term holder behavior around 76k would’ve made this piece actually useful.