











































What to Know
- $5.5 billion in 24-hour cumulative net taker volume on Binance, a 72% jump from $3.2 billion earlier this month
- $2,475 to $2,634 fair-value gap is the next upside target if ETH breaks $2,400 resistance
- Funding rates sit near neutral while futures CVD climbs toward $12.6 billion, a rare combination of demand without stretched leverage
The Ether taker volume 72% jump on Binance over the past week has flipped the short-term narrative for ETH, with aggressive buyers pushing 24-hour cumulative net taker volume to $5.5 billion from $3.2 billion at the start of the month. Ether futures now sit at a near two-month high, and the tape looks less like a dead-cat bounce and more like real, sticky demand. That is the part traders were waiting for.
Ether Taker Volume 72% Spike: What The Binance Tape Is Saying
Net taker volume tracks the gap between market buys and market sells. When it runs positive and keeps running positive, someone with size is willing to pay the offer instead of waiting at the bid. On Binance right now, that is exactly what is happening with ETH. The 24-hour reading of $5.5 billion is a 72% bump from the $3.2 billion print earlier in April, according to CryptoQuant’s Quicktake breakdown of the derivatives tape.
The 30-day moving average has stayed in positive territory since March 1. That is the longest green streak on this metric since July 2022, and it is the sort of reading that quant desks tend to notice before retail headlines catch up. Persistent positive taker volume is not the same as a single panic-buy candle. It is buyers showing up every session, day after day, eating offers.
When the buying spikes near local highs, it signals stronger conviction from participants. The sustained demand of this kind often keeps buyers in control of the short-term price direction.
Why Is ETH Targeting The $2,475 To $2,634 Liquidity Gap?
Short answer: there is a hole in the order book up there and price tends to fill holes. The $2,475 to $2,634 range is a daily fair-value gap that formed during February’s sell-off, when ETH dropped so fast that orders on the way down never got matched. Those unfilled levels now act like a vacuum above current price.
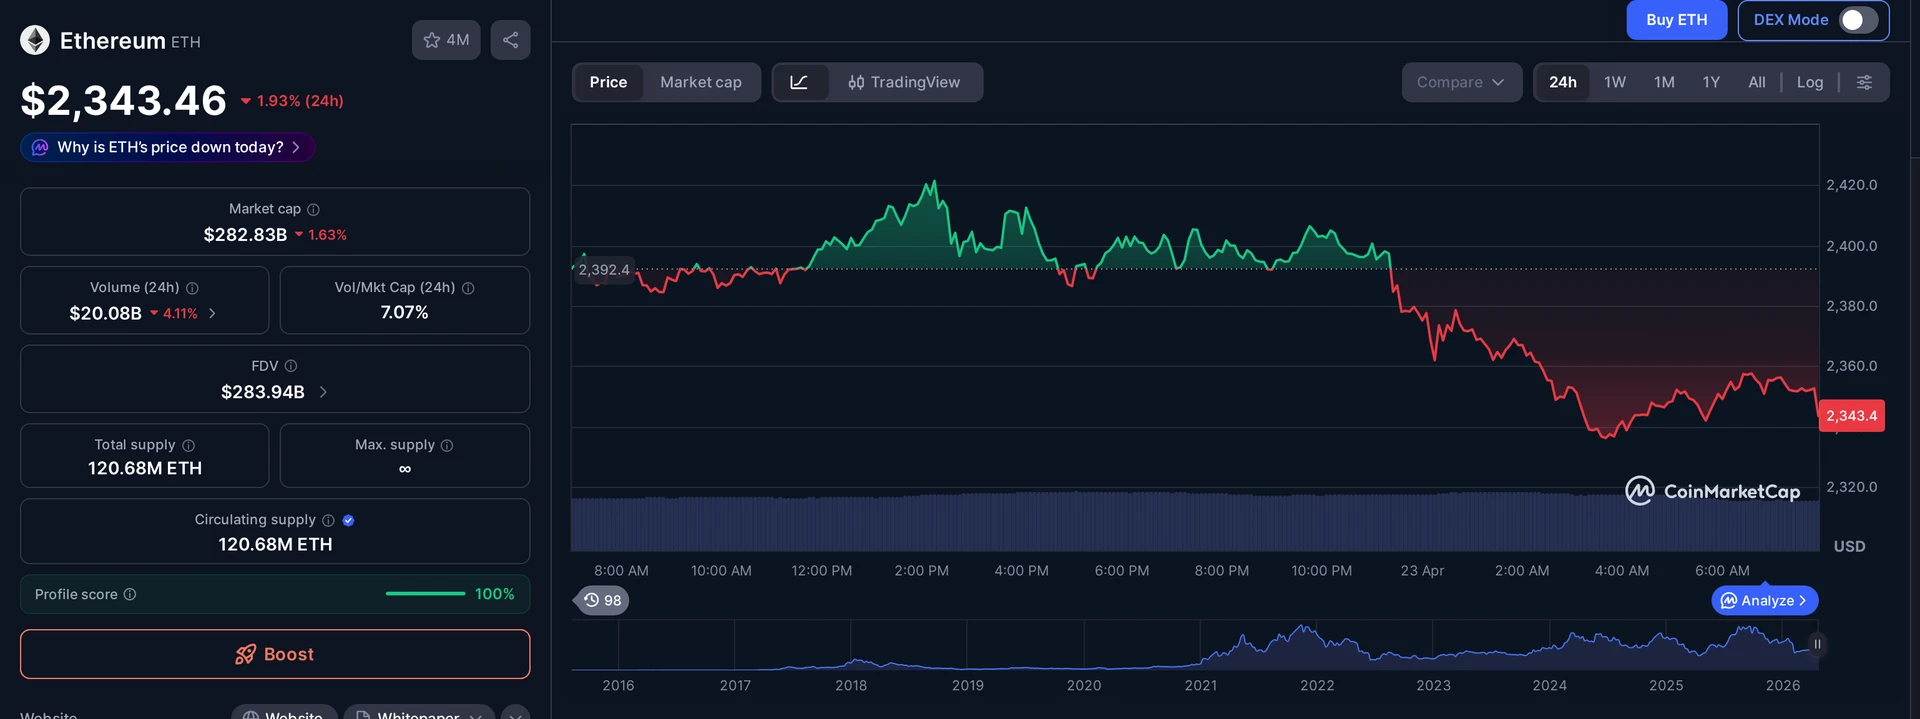
ETH is compressing just under $2,400, a ceiling that has been tested three separate times since Feb. 6. Each rejection has chewed through more of the sitting sell orders overhead. That is the bullish read of repeated failure. The bearish read is that three rejections is three rejections. Pick your side, but the shrinking supply wall is measurable, not vibes.
- Feb. 6: first rejection at $2,400 on heavy volume
- Second and third rejections thinned the sell side each time
- Fair-value gap at $2,475 to $2,634 formed in February’s sell-off
- 200-day EMA drifting into the upper end of the gap near $2,634
- 100-day EMA reclamation in progress, a classic trend-continuation tell
The Analyst Call: Conviction Buying, Not FOMO
CryptoQuant analyst Amr Taha reads the current tape as textbook bullish continuation. His point is that taker spikes at local highs behave differently from taker spikes at local lows. Lows get bought by bottom-fishers. Highs get bought by traders who believe the next leg is already starting.
That distinction matters for anyone sizing positions. A buy-the-dip cohort tends to sell into strength. A buy-the-breakout cohort tends to add. The latter is what keeps rallies alive past the point most mean-reversion traders bail out. And that is the cohort CryptoQuant’s data is flagging on Binance right now.
The ETH buy-taker volume chart on Binance shows buy-taker volume pushed above $5 billion, the level that historically precedes multi-week trend moves rather than one-session pops. Pair that with a 30-day positive average, and the case for dismissing this as a squeeze gets harder to make.
Leverage Is Quiet, And That Is The Bullish Part
Here is the detail most day traders will gloss over. Futures cumulative volume delta (CVD) is climbing toward $12.6 billion, meaning aggressive buying keeps absorbing aggressive selling. Normally, a move like this would light funding rates on fire. It has not. Funding sits near neutral.
Translation: leverage has not expanded alongside price. Spot demand and measured futures positioning are doing the work. That is the opposite of the January setup that got blown out on a single liquidation cascade. No stretched longs means less kindling for a downside flush. It also means the move has more room to extend before the usual leverage unwinds force a cooldown.
This is the sort of structure that bulls dream about and shorts hate. Real buying. No crowded leverage to punish. A defined upside target at the fair-value gap. If ETH breaks $2,400 cleanly and flips it to support, the $2,475 to $2,634 zone becomes the natural magnet, and the 200-day EMA parked near $2,634 adds a second layer of confluence.
The balance between buyer demand and measured leverage keeps the $2,475 to $2,634 zone in focus as a near-term liquidity cluster.
What Can Go Wrong: The Bear Case Nobody Wants To Read
Taker volume is a demand signal, not a guarantee. ETH has failed at $2,400 three times for a reason, and the macro tape is not exactly screaming risk-on. If buyers cannot force a daily close above that level within the next week or so, the pattern flips. Rejected breakouts on rising volume often become the entry trigger for short sellers who were waiting on the sidelines.
The other risk is the CVD diverging from price. If ETH keeps pressing higher but CVD stalls, it means the marginal buyer is running out of conviction. That is the kind of quiet signal that precedes reversals by days, not minutes. Traders watching this setup should keep one eye on that line.
And there is always the wildcard of a broader crypto drawdown. Bitcoin’s behavior at its own resistance will shape whether ETH gets the clean air it needs. Alt rallies without BTC cooperation tend to be short. Alt rallies with BTC trending tend to extend. Right now, ETH needs BTC to behave.
What Traders Are Watching Next
The next 72 hours are the tell. A daily close above $2,400 opens the fair-value gap as a direct target. A failure and a close back under $2,320 or so puts the compression range back in play, and taker volume would need to stay positive to keep the bullish thesis alive.
The 100-day EMA reclamation is also worth tracking. Ether trading consistently above that line has historically marked the middle innings of trend-continuation phases, not the top. If price holds that level on any pullback, dip buyers get a cleaner risk-defined setup.
Nothing here is a promise. But the combination of 72% higher taker volume, neutral funding, a climbing CVD, and a clearly defined upside magnet at $2,475 to $2,634 is about as clean a bullish structure as ETH has offered in months. The derivatives market is voting with both hands. Whether spot confirms is the next question.
Frequently Asked Questions
What does a 72% rise in Ether taker volume mean?
A 72% rise in Ether taker volume means aggressive market buyers on Binance are paying the offer at a far higher rate than earlier in the month. Net taker volume jumped from $3.2 billion to $5.5 billion in 24 hours, a signal that buyers, not sellers, are driving ETH’s short-term price action.
Why is the $2,475 to $2,634 range important for ETH?
The $2,475 to $2,634 range is a daily fair-value gap left over from February’s sell-off, where ETH dropped fast and orders went unfilled. Price often revisits these zones to rebalance flows. The 200-day EMA also sits near $2,634, creating a technical overlap that makes the zone a magnet.
Is leveraged trading driving this ETH rally?
No. Funding rates remain near neutral even as futures cumulative volume delta climbs toward $12.6 billion. That means leverage has not expanded aggressively alongside price. The rally is being powered by consistent spot demand and measured futures positioning rather than crowded leveraged longs that usually precede violent reversals.
What would invalidate the bullish ETH setup?
A daily close back under roughly $2,320 would invalidate the compression breakout. A fourth rejection at $2,400 on declining taker volume would also flip the structure, giving short sellers an entry trigger. Traders should also watch for CVD stalling while price pushes higher, a classic divergence warning sign.
This article is for informational purposes only and does not constitute investment advice. Every investment and trading decision involves risk. Readers should conduct their own research before making any financial decisions.


















72% taker volume spike is real but worth checking against open interest. If OI didn’t move much it’s just spot rotation, not leveraged conviction. Anyone got the OI delta on Binance perps for the same window?
the $2,475 to $2,634 gap has been sitting there since the March wick, surprised it took this long to get tagged as a magnet
fair value gaps fill both ways. everyone screams long when buyers take control then gets liquidated on the retrace into 2380
Been trading ETH since 2017 and these taker imbalance spikes used to mean something before the perp market got this deep. Now you need CVD divergence across at least three venues before I’d call it directional. One Binance print is noise.
calling 2600 off a single session of taker pressure feels early
Curious if anyone is tracking how the spot ETF flows lined up with this. If the Binance taker buying matches a green ETF day that’s a different story than just Asia session leverage piling in.