
What to Know
- Maxi Trades warns Bitcoin could fall roughly 30% to $50,000 if the current range breaks to the downside
- BTC has traded sideways for more than two and a half months after rebounding above $78,000
- Past consolidations of 64 to 114 days preceded swings as steep as a 33% crash, the analyst says
- Bitcoin is still more than six months into a bear market that began near $126,000 in October 2025
A Bitcoin 30% crash toward $50,000 is back on the table, according to market watcher Maxi Trades, who thinks the current grind above $78,000 is the quiet before a much uglier move. Posting his read on X this week, the analyst argued that Bitcoin’s refusal to stay range-bound forever, paired with a bear market that has now dragged on for more than six months, sets up another capitulation leg before any real bottom prints. If he is right, the flagship coin has one more air pocket to fall through.
Why Does the Bitcoin 30% Crash Scenario Target $50,000?
The short answer: time in the range. Maxi Trades notes Bitcoin has been stuck in a tight corridor for more than two and a half months, and every comparable consolidation recently ended with a violent resolution. His case leans on three near-identical setups, two of which ended in sharp drawdowns.
In the first instance, Bitcoin chopped sideways for 64 days before popping 14% higher. The second stretch lasted 114 days and resolved with a 27% slide. The third, a 77-day grind, ended in a 33% crash. The pattern, as Maxi sees it, is not that the range always breaks one way. It is that the range always breaks, and usually hard. That framing matters because a Bitcoin 30% crash to $50,000 would sit squarely inside the historical drawdown band for post-peak cycles.
The last three times Bitcoin displayed this kind of range-bound movement, it took roughly 64 to 114 days for a breakout. Two of those three broke lower, and they broke hard.
The Bear Market Is Older Than Most Traders Realize
Here is the part that gets glossed over in the daily price chatter. Bitcoin has been in a Bitcoin bear market for more than six months, dating back to its October 2025 top. That is not a dip. That is a regime.
Maxi’s argument hinges on a tell that veteran traders recognize: real bottoms look like panic. They come with forced liquidations, washed-out funding rates, and the kind of price action that scares long-term holders into selling. Bitcoin has not done that. Instead it has drifted, bounced, and drifted again, which is closer to distribution than capitulation.
That is why he is skeptical of anyone calling the low at $78,000. A market that has not panicked has not bottomed. By his read, the heavy hand on the tape is still selling into strength, and the absence of a true flush is a signal the next move is the one everyone was hoping to avoid.
From $126,000 to $50,000: The Full Round Trip
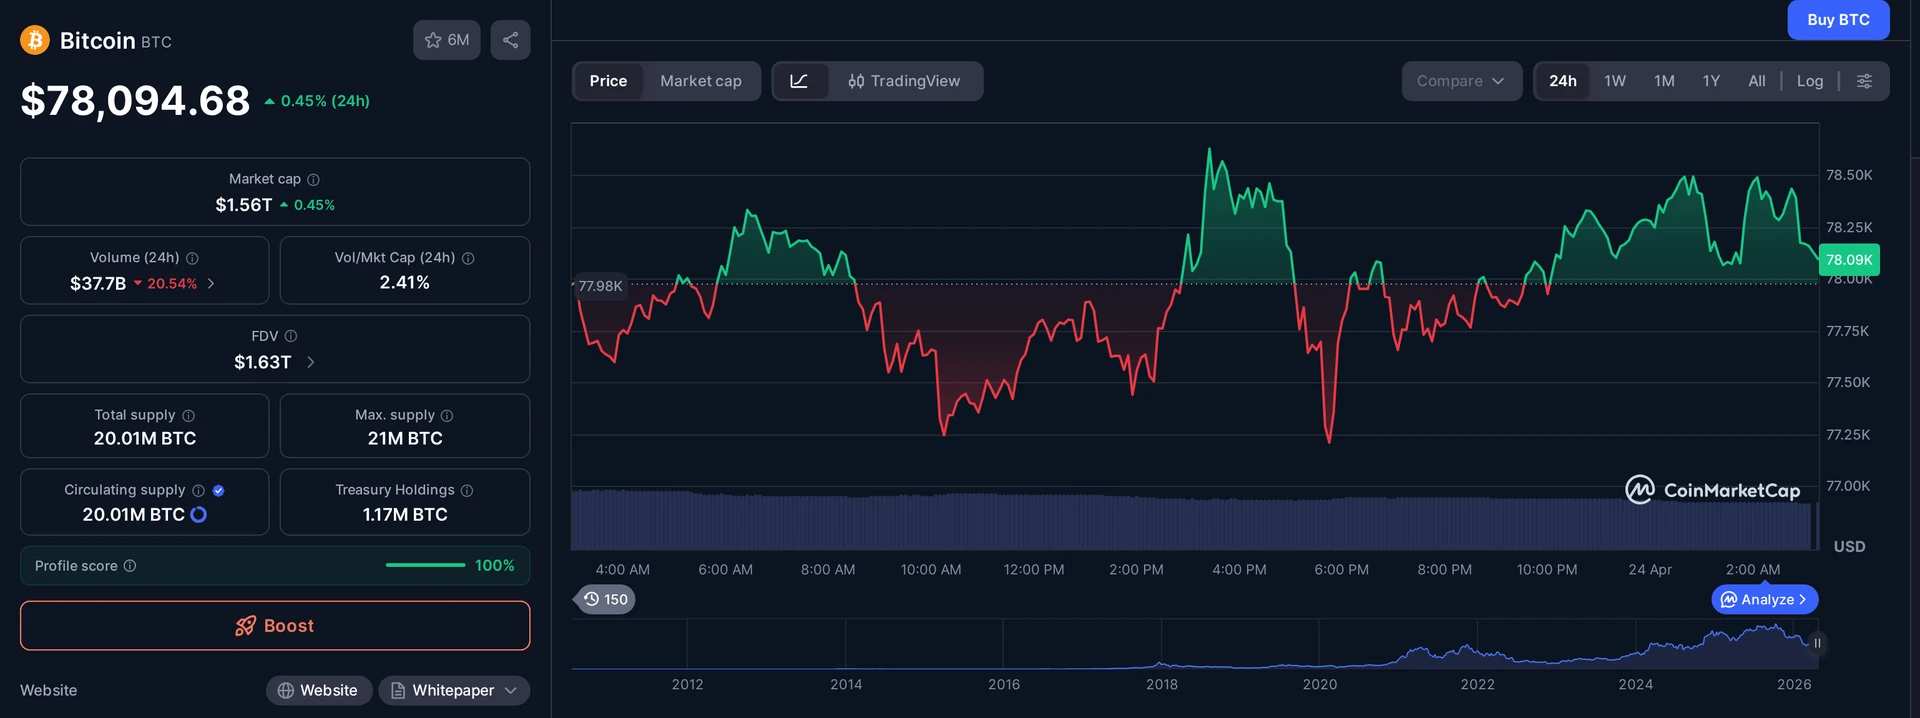
Some context on how far this drawdown has already come, and how much further Maxi thinks it could go. Bitcoin set a fresh Bitcoin all-time high near $126,000 in early October 2025, capping a run that had convinced a lot of people the cycle top was still out of sight. Six months later, spot is closer to $78,000, roughly 38% below that peak.
A move to $50,000 from here would be another 36% down from current levels, and just over 60% off the all-time high. That is a severe drawdown by any standard, but it is not unprecedented. Past Bitcoin cycles have repeatedly carved out peak-to-trough declines in the 70% to 80% range before printing multi-year lows.
So the question is not whether a $50,000 print is possible. The question is whether this cycle bottoms like past cycles or whether spot ETF flows, corporate treasuries, and structural demand have changed the shape of the curve. Maxi’s view is that they have not, at least not enough to stop a final flush.
- October 2025 peak: near $126,000
- Current spot: above $78,000, down roughly 38% from the high
- Maxi’s target: $50,000, about 36% below current levels
- Full drawdown scenario: more than 60% from the all-time high
What Has to Happen for the Bearish Call to Play Out?
Two things, basically. First, the current range has to break to the downside, not the upside. Any clean reclaim of the local highs and the setup falls apart. Second, the breakdown has to come with follow-through, not just a wick below the range low that gets bought immediately. A real capitulation move tends to feed on itself, with liquidations piling onto liquidations until use is wrung out of the system.
Maxi is not calling for this to happen next week. His own framework says the consolidation could run another stretch before it cracks, matching the 64 to 114 day envelope of past setups. That gives bulls time to disprove the thesis, but it also means the trigger could arrive without much warning once the range does break.
On the flip side, a strong close back above the mid-range with rising volume would blow up the short setup fast. Bitcoin has a habit of punishing anyone who gets too certain about direction during a long consolidation, and a 14% squeeze higher is exactly what happened the first time this pattern showed up in the data.
How Should Traders Read This Call?
With the usual caveat: one analyst, one chart framework, one outcome on the table. Maxi Trades is not the consensus. Plenty of other traders are working the opposite thesis, arguing that the $78,000 shelf is the accumulation zone for the next leg higher. Both sides cannot be right.
What the call does do is force a useful question. If you are long spot Bitcoin and a 30% drawdown from here would break your thesis, your plan, or your sleep, the time to hedge or size down is before the range breaks, not during the breakdown. The worst place to act is halfway into a liquidation cascade.
And if Maxi is wrong, so be it. Bears get shaken out in this market constantly. But dismissing the setup because the number sounds scary is not analysis, it is hopium. The same chart that printed $126,000 printed this range, and the range has to resolve somewhere.
The market has likely not reached its final capitulation phase. I am highly confident the next breakout is to the downside.
The Take: A $50,000 Print Would Be Brutal, Not Unthinkable
A 60% drawdown from the top would sting. It would also be perfectly normal for Bitcoin. The coin has done this before, and it has paid off for the patient every single time. The uncomfortable part of Maxi’s forecast is not the number. It is the reminder that six months into a bear market, nobody has seen the kind of fear that usually marks the end of one.
Until that fear shows up on the tape, the floor is a theory, not a fact.
Frequently Asked Questions
What is Maxi Trades' Bitcoin price target?
Maxi Trades forecasts a Bitcoin 30% crash from current levels above $78,000 to roughly $50,000. The analyst bases the call on historical consolidation patterns where similar range-bound setups resolved with drawdowns of 27% to 33%, arguing that Bitcoin has not yet reached its final capitulation phase after six months in a bear market.
How long has Bitcoin been in a bear market?
Bitcoin has been in a bear market for more than six months, dating back to its October 2025 all-time high near $126,000. Spot prices have since fallen roughly 38% to the $78,000 area, but the analyst argues the tape still shows no signs of the panic selling and forced liquidations that typically mark a true cycle bottom.
What was Bitcoin's all-time high in 2025?
Bitcoin set its current all-time high above $125,000 in early October 2025, peaking near $126,000 before rolling over. Every drawdown discussed in Maxi Trades’ forecast, including the potential $50,000 target, is measured against that October peak as the reference top of the current market cycle.
When could the Bitcoin range break according to the analyst?
Maxi Trades says past consolidations of this type resolved in 64 to 114 days. Bitcoin has now traded sideways for more than two and a half months, putting it inside that historical window. The breakout could arrive at any point in the coming weeks, though the analyst expects it to break lower rather than higher.
This article is for informational purposes only and does not constitute investment advice. Every investment and trading decision involves risk. Readers should conduct their own research before making any financial decisions.