
What to Know
- XRP price is pinned between $1.43 and $1.45 after a failed push above $1.44 earlier in the session
- Spot XRP ETFs added fresh inflows, lifting total institutional positioning above $2.6 billion
- Nearly 35 million XRP left exchanges in one of the largest daily outflows of 2026
- $1.50 is the breakout trigger; $1.39 is the line that, if lost, breaks the entire setup
The XRP price is doing the thing it always does right before something snaps. It is grinding. Stuck under $1.44 with sellers fading every push and buyers quietly defending every dip, the token is coiling inside a multi-week pattern that traders have watched tighten since early April. Each rejection sits a little lower. Each bounce sits a little higher. That is not indecision. That is pressure building.
Why Is XRP Stuck at $1.44?
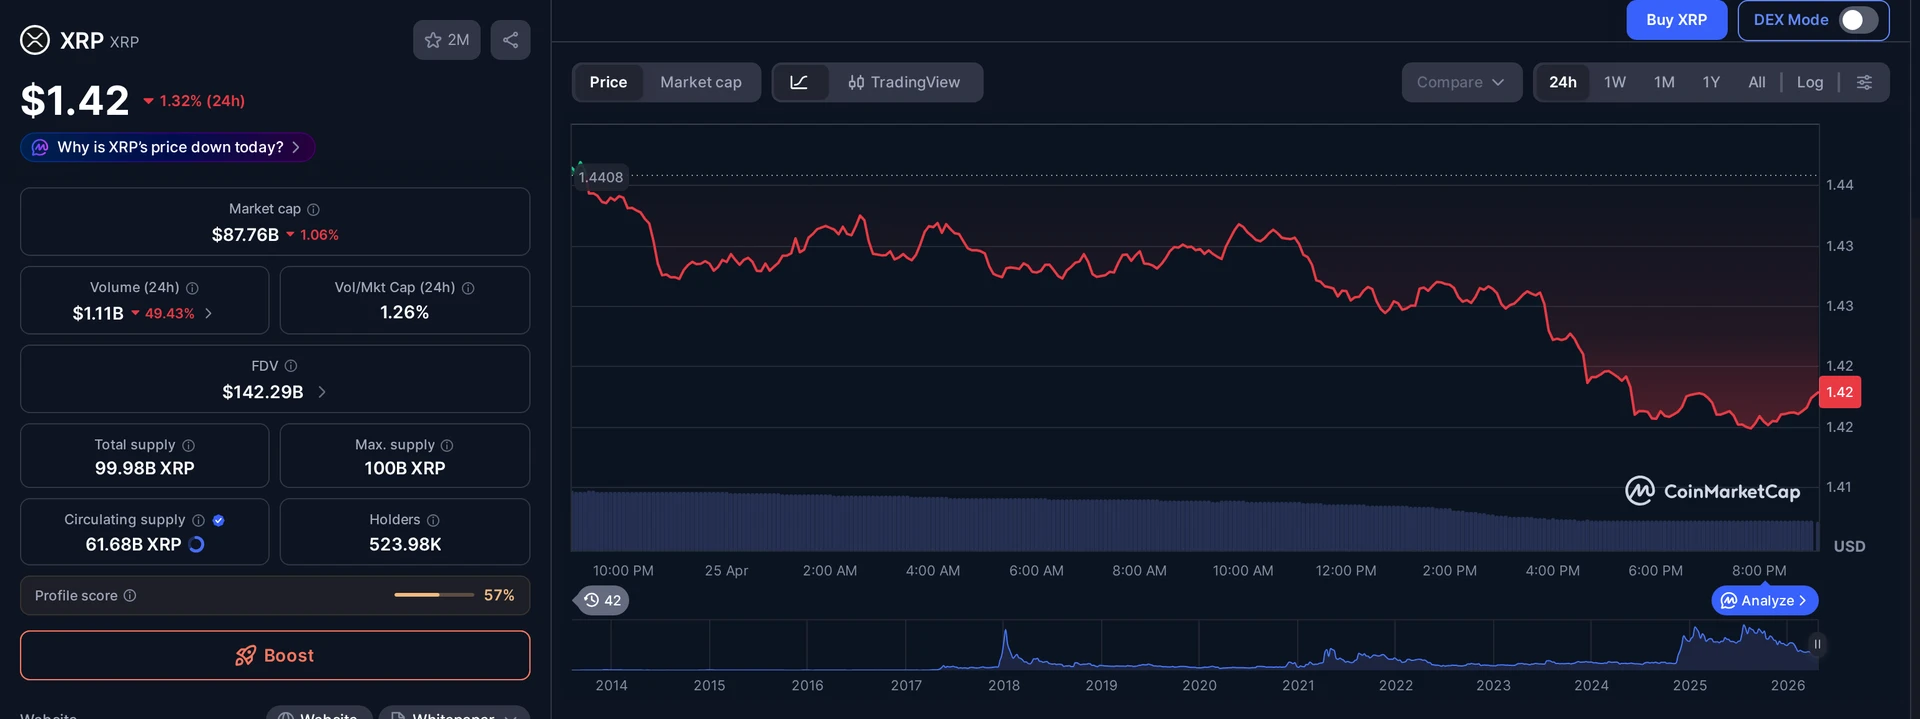
The XRP price is pinned between $1.43 and $1.45 after a brief push above $1.44 failed to hold. Price has spent two weeks rotating in a band that narrows with every candle. The action looks like classic supply absorption: heavy volume on the push, fading volume on the rejection, then quiet sideways drift.
The pattern matters because of how the rejections are arriving. Sellers are not slamming price lower the way they would in a distribution top. They are simply capping it. Each lower high arrives a few cents under the last one, and each higher low arrives a few cents above. That is the geometry of a coil, not a top.
Underneath the chart, positioning is quietly building. Spot demand has not gone away. Derivatives funding is flat to mildly positive. Open interest is climbing without the violent funding spikes that normally precede a long squeeze. None of that proves direction. It does suggest that the next move is being loaded, not unwound.
Spot XRP ETFs Keep Soaking Up Supply
Institutional flows refuse to slow down. Spot XRP ETFs registered another round of fresh inflows this week, pushing total institutional positioning above $2.6 billion. That extends the strong demand that began in mid-April and shows no sign of cooling, even as the spot price refuses to break out.
This is the part of the setup that gets underplayed. ETF inflows landing while price stalls is not a neutral signal. It means somebody large is buying into weakness instead of chasing strength. Funds do not push billions into a stalling chart for fun. They do it when the desk view says the next leg is up and the entry is being scaled rather than triggered.
The flip side is real. ETF flows can reverse fast, and a single week of net redemptions could turn that quiet bid into an air pocket. For now, though, the tape says accumulation.
ETF inflows landing while price stalls is not a neutral signal. It means somebody large is buying into weakness instead of chasing strength.
XRP Exchange Outflows Hit a Yearly High
On-chain data adds the second leg of the bullish read. Nearly 35 million XRP left centralized trading platforms in one of the largest daily readings of 2026. That kind of XRP exchange outflows print typically points to coins moving into cold storage, custody, or staking arrangements rather than sitting on order books waiting to be sold.
Less float on exchanges means thinner sell-side liquidity. Thinner liquidity means a smaller buy can move price further. Combine that with the ETF accumulation and you get a market where the available supply for sale is shrinking while the size of the demand quietly grows. That is the recipe for the kind of fast move the chart is hinting at.
- 35 million XRP withdrawn from exchanges in a single day
- Largest daily outflow reading recorded so far this year
- Reduces immediate sell-side pressure across spot venues
- Pairs with $2.6 billion in ETF positioning to tighten available float
The Symmetrical Triangle Everyone Is Watching
Pull up a daily XRP chart and the dominant structure is impossible to miss. A multi-week symmetrical triangle has been forming since the start of April, with a descending line of lower highs meeting an ascending line of higher lows. Price is now compressed deep into the apex, which is exactly where these patterns resolve.
Volume tells the same story. The breakout attempt above $1.44 earlier in the week arrived on a clean spike. Then volume dried up almost immediately. That fade after the push is what traders call absorption: the move ran into a wall of resting offers, those offers got eaten, and the tape went quiet while the next round of decision-making happens.
Buyers continue to defend higher lows, which keeps downside contained for the moment. Bears have not surrendered, but they have not pushed either. The market is coiled. Neither side is in real control. The longer that lasts, the bigger the eventual move tends to be when one side finally breaks.
What Are the Key XRP Price Levels?
Two numbers matter right now. The breakout trigger sits at $1.50, the level that has rejected every meaningful rally since the structure formed. A clean daily close above $1.50 would shift momentum decisively and likely invite a fresh wave of momentum buyers and short covering at the same time.
On the downside, $1.39 is the line in the sand. It marks the lower boundary of the triangle and the area where buyers have repeatedly stepped in. A daily close beneath $1.39 would invalidate the pattern and open a much messier path lower, with the next obvious support a fair distance below current price.
- $1.50 breakout level: a clean break flips momentum higher
- $1.44 immediate resistance, the failed-breakout zone
- $1.39 structural support, the floor of the triangle
- Below $1.39: pattern fails, downside opens
Bull Case vs Bear Case
Call it what you want, but the weight of evidence is leaning one way. ETF inflows are positive. Exchange balances are falling. Higher lows keep printing. The chart is squeezing rather than rolling over. None of that guarantees a breakout, and crypto has a long history of resolving these setups in the direction nobody expected. But the setup is not symmetrical from a flow perspective even if it is symmetrical from a chart perspective.
The bear case is simple: ETF flows reverse, a macro shock hits risk assets, and the $1.39 floor cracks on a Sunday wick when liquidity is thin. That scenario is not far-fetched, and any trader sizing a position needs to respect it. But it requires a catalyst the current tape is not telegraphing.
The bull case writes itself if $1.50 gives way. A reclaim of that level brings trapped shorts into the conversation, ETF marketing engines kick into a higher gear on the headline, and the squeeze that has been building for weeks finally has somewhere to go.
Frequently Asked Questions
What is the current XRP price?
XRP is trading between $1.43 and $1.45 after a brief push above $1.44 failed to extend. Price is consolidating inside a multi-week symmetrical triangle, with $1.50 acting as the key breakout level above and $1.39 marking the critical support below the current range.
Why are spot XRP ETFs important right now?
Spot XRP ETFs have absorbed enough inflows this month to push total institutional positioning above $2.6 billion. Those flows continued landing even as price stalled, which suggests funds are accumulating into weakness rather than chasing rallies. That steady bid tightens available supply and supports the case for an upside resolution.
What does a symmetrical triangle mean for XRP?
A symmetrical triangle forms when price prints lower highs and higher lows that converge toward a single point. It signals that volatility is compressing and a sharp move is likely once one side breaks. For XRP, the triangle apex is near current levels, with $1.50 and $1.39 as the resolution boundaries.
Why do XRP exchange outflows matter?
Large XRP exchange outflows, like the 35 million XRP withdrawn in a single day this week, signal that holders are moving coins off trading venues into custody or cold storage. That reduces the supply immediately available for sale, thins order-book liquidity, and tends to amplify upside moves when buying pressure arrives.
This article is for informational purposes only and does not constitute investment advice. Every investment and trading decision involves risk. Readers should conduct their own research before making any financial decisions.