











































What to Know
- The Bitcoin Bull Score Index crossed into neutral at 50 for the first time this bear cycle, a six-month high.
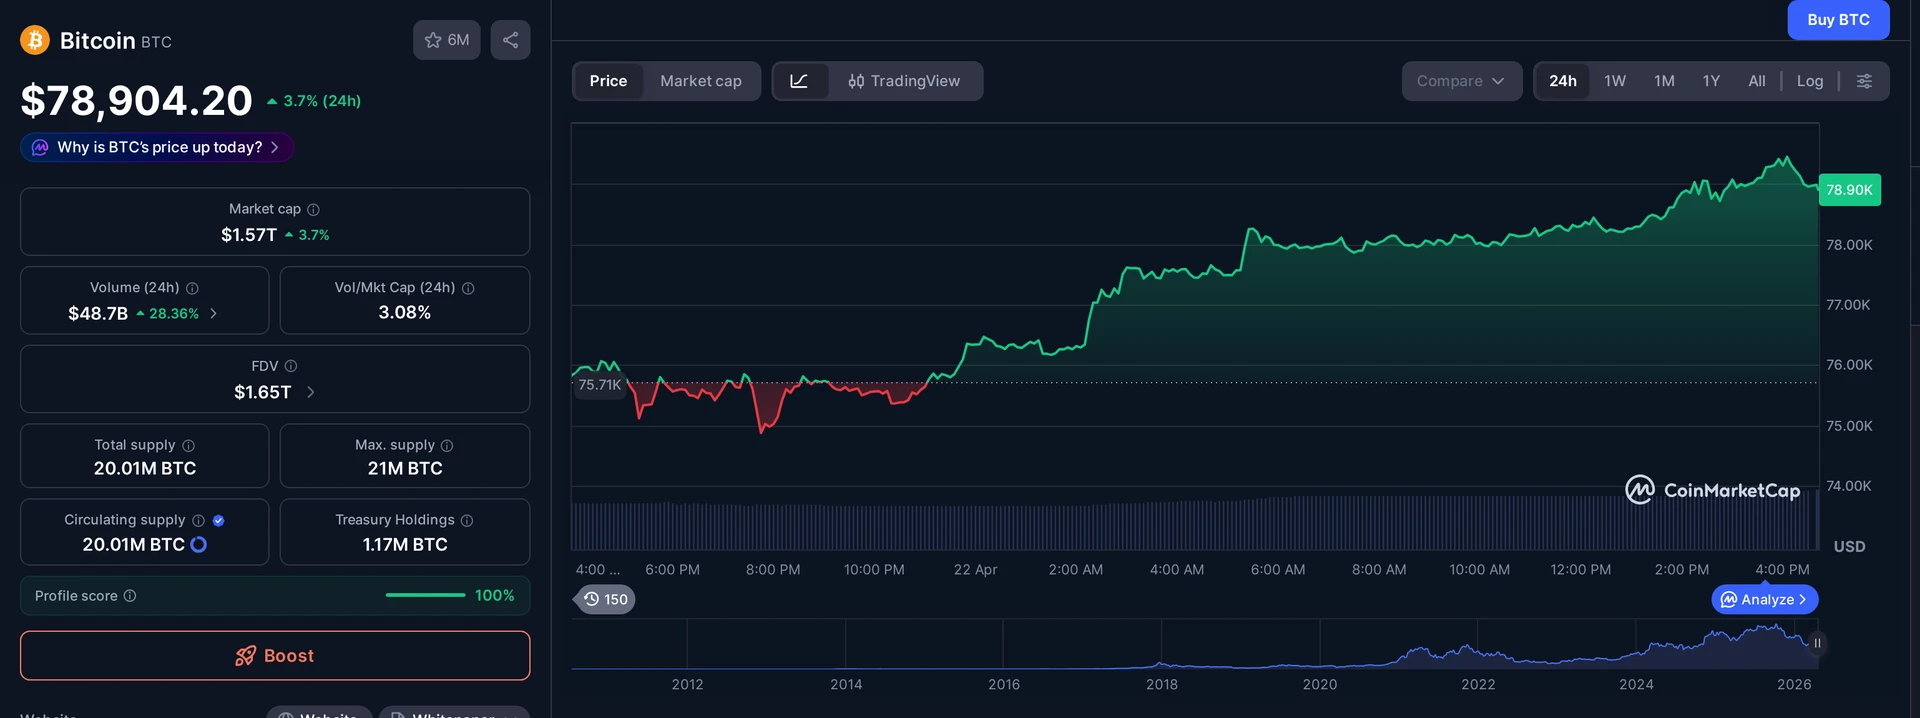
- Bitcoin reclaimed $78,000 this week after weeks stuck below the key $74,000 level.
- The Crypto Fear & Greed Index reads 32 today, up from 23 last week but still parked in fear.
- CryptoQuant analyst Julio Moreno flags the March 2022 pattern, a brief neutral reading, then a fresh leg down.
The Bitcoin Bull Score Index just printed its most encouraging reading in six months, and traders who survived 2022 are already side-eyeing the charts. CryptoQuant data published Wednesday shows the nine-metric composite climbed into neutral territory at 50 as Bitcoin clawed back to $78,000. That is the first time the indicator has left its bearish basement since the current downturn began. It is also the exact setup that preceded the second wave of the 2022 collapse, which is why nobody in the analyst community is uncorking champagne just yet.
Bitcoin Bull Score Index Crawls Out of the Basement
For months, the Bitcoin Bull Score Index has been pinned near zero, flashing the kind of reading you only see when sellers control the tape. That changed this week. The composite, which blends nine on-chain and market-structure metrics into a single 0-to-100 score, finally ticked up to 50, the line that separates bearish conditions from neutral ones.
Julio Moreno, head of research at the analytics shop behind the index, called it out plainly on X. His language was not euphoric. It was cautious. The kind of cautious that comes from watching this exact pattern unfold badly before.
First time in this bear market that the Bull Score Index enters neutral zone (50).
Why Does the 2022 Comparison Keep Coming Up?
Because the chart is almost a photocopy. In March 2022, roughly four months into that bear market, the Bull Score poked into neutral for about a week before Bitcoin slid toward the $16,000 low. Moreno is not predicting the same outcome. He is flagging the precedent.
The echo matters because a neutral reading is not a buy signal. It is a ceasefire. The CryptoQuant dashboard treats anything above 60 as the real bullish zone, while anything below 40 screams capitulation. A print of exactly 50 is the market collectively shrugging, and shrugs have a habit of turning into frowns when macro wind shifts.
Contributor Arab Chain put it more technically last week, when BTC was hanging around $74,000 and the Bull Score sat just below neutral. The read then was balance, not strength. That balance can tip either way, and historical precedent suggests it tips toward sellers more often than not during the first leg of a relief rally.
The current BSI reading shows that the market is still far from the area of strong optimism (above 60), which typically indicates strong bullish conditions, while also remaining above the zone of extreme pessimism (clearly below 40).
Fear and Greed Stops Screaming, Starts Whispering
The Bull Score is not the only gauge that has softened. The Crypto Fear & Greed Index, a sentiment reading that blends volatility, momentum, volume, social chatter, and dominance into a single number, climbed to 32 on Wednesday. A week ago it was 23. That is a near-tripling of the reading in eight days, which sounds dramatic until you remember both numbers still sit inside the fear zone.
Context is doing a lot of heavy lifting here. The gauge has not printed anything resembling greed since mid-January, when Bitcoin was still trading comfortably above $100,000. The recovery to 32 matters because it confirms the Bull Score is not an isolated blip. Sentiment and on-chain metrics are nudging higher together, which is usually how sustainable bottoms start forming.
It is also how fake bottoms start forming. That is the uncomfortable truth traders have to sit with.
- 23 last week: Extreme Fear, the lowest since the March lows
- 32 today: Fear, but at its least negative since mid-January
- 50+ needed: threshold for neutral sentiment, still roughly 18 points away
- 75+ needed: the actual greed zone, which would signal trend reversal
What Bitcoin Needs to Do From Here
Price action tells the tape, and the tape says Bitcoin is trying to break out of a multi-month range it has been chopping inside since early this year. BTC reclaimed $78,000 this week after weeks stuck below $74,000. The April monthly close is now the chart level that matters most. A close above the range high confirms the Bull Score uptick as the start of something real. A rejection back into the range hands 2022-watchers their I-told-you-so moment.
Volume is the tell. A breakout on thin participation tends to fail within two weeks, which is exactly what happened during that March 2022 relief rally. A breakout on rising spot volume, with perpetual funding staying flat rather than flipping aggressively positive, has a much better chance of holding. The nine-metric composite tracks these under the hood, which is why it is useful as a confirmation tool rather than a prediction engine.
Short-term traders are already positioning for volatility in either direction. Options open interest on major venues has been climbing into the monthly close, with put-call ratios suggesting a roughly even split between hedges and directional bets. The crowd is not convinced yet, and the crowd is usually right until the moment it is not.
The Honest Read for Anyone Holding Bitcoin
Here is the take nobody wants to write. A neutral Bull Score is good news dressed in very practical clothing. It says the forced selling has paused. It says on-chain cohorts have stopped panic-distributing. It does not say the bear is over, and the analysts who built the index are refusing to pretend otherwise.
If you are holding Bitcoin through this, the recovery in composite metrics is the first thing you have had to point at in months that is not purely vibes-based. That is worth something. If you are trading it, the 2022 script is on the table as a live scenario, and ignoring it because this time feels different is how people blew up their accounts four years ago.
The monthly close will do the talking. Until then, neutral is neutral, and neutral is not bullish.
Frequently Asked Questions
What is the Bitcoin Bull Score Index?
The Bitcoin Bull Score Index is a composite indicator built by CryptoQuant that blends nine price and on-chain metrics into a single 0-to-100 reading. Scores below 40 signal bearish conditions, 40 to 60 is neutral, and above 60 indicates strong bullish momentum. It is used to gauge overall market health rather than predict short-term price moves.
Why does the Bull Score reaching 50 matter now?
A reading of 50 marks the first time the index has exited bearish territory since the current downturn began. It signals that forced selling has eased and on-chain conditions have stabilized. But 50 is only neutral, not bullish. Analysts warn a similar brief recovery in March 2022 preceded another major leg down in Bitcoin price.
How does the Crypto Fear & Greed Index compare to the Bull Score?
The Crypto Fear & Greed Index measures investor sentiment using volatility, momentum, social media chatter, volume, and Bitcoin dominance. The Bull Score focuses on on-chain and market-structure data. Both are currently climbing together, with Fear & Greed at 32 and the Bull Score at 50, which suggests a coordinated but still fragile recovery in conditions.
Could Bitcoin repeat the 2022 bear market pattern?
It is possible. In March 2022, the Bull Score briefly hit neutral before Bitcoin resumed a steep decline toward $16,000. CryptoQuant analyst Julio Moreno flagged the parallel directly. The difference this cycle could be macro conditions, spot ETF flows, and institutional positioning, but the technical setup is close enough that risk management matters more than conviction right now.
This article is for informational purposes only and does not constitute investment advice. Every investment and trading decision involves risk. Readers should conduct their own research before making any financial decisions.


















Bull Score at 50 is literally the definition of neutral, not bullish. Calling a neutral print a six-month high is accurate but the headline makes it sound like euphoria when we’re just crawling out of the basement.
cryptoquant has been waving the 2022 flag for about a year now. broken clock eventually right i guess
The parallel to 2022 only holds if you think miner capitulation and exchange outflows look similar to now. They don’t, not even close. Hashprice and realized cap trajectory are in a completely different regime this cycle.
Anyone know which sub-metric inside the Bull Score flipped to push it back to 50? Is it the on-chain side or the market momentum side doing the heavy lifting here?
Been through 2018 and 2022, neutral readings after a drawdown are where people get chopped up worst.