What to Know
- The 30-day correlation between bitcoin and the Dollar Index just hit -0.90, the deepest inverse reading since September 2022
- 81% of bitcoin’s short-term price moves are now statistically tied to the greenback’s direction
- Anthony Scaramucci says a real BTC recovery may not arrive until October or November
- The ETH/BTC ratio dropped to 0.02965, its lowest since March 15, confirming ether keeps losing ground
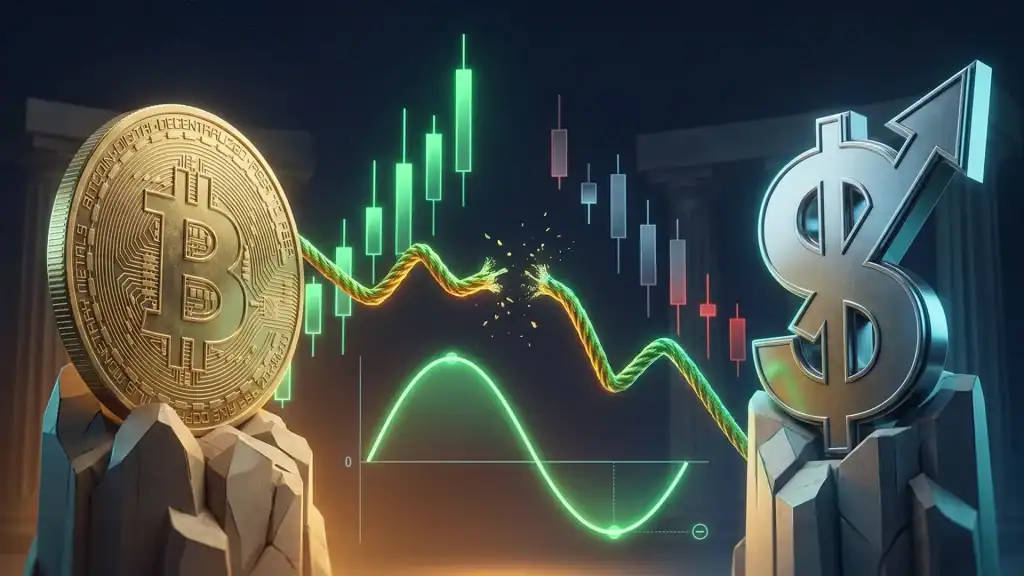
The bitcoin dollar inverse correlation just went from background noise to the main event. The 30-day correlation coefficient between BTC and the Dollar Index has slid to -0.90, the most negative reading since September 2022, according to TradingView data. Translation for anyone not fluent in stats jargon: when the dollar coughs, bitcoin rips, and when the dollar flexes, bitcoin stalls. Right now, the dollar is flexing. Bitcoin is stalling. That’s the part that matters if you’re holding BTC into the weekend.
What the Bitcoin Dollar Inverse Correlation Is Actually Saying
A correlation of -0.90 is almost mechanical. Pair that with a coefficient of determination at 0.81, and roughly 81% of bitcoin’s short-term price action is statistically explained by moves in the Dollar Index, a benchmark administered by ICE that measures the greenback against six major currencies. For context, a reading of -1.00 would mean the two assets trade like mirror images.
The caveat is real, though. BTC trades 24/7. The DXY takes weekends off. Weekend price action on bitcoin, the stuff that moves on thin liquidity and Asian-session headlines, never gets reflected in the dollar basket. Which means the correlation looks cleaner on paper than it behaves in your P&L.
Macro is still trying to lean against it. Oil has risen for five straight sessions and Hormuz remains effectively constrained. That should be a headwind because it keeps the inflation channel alive and keeps risk premia from fully unwinding.
Why Is Bitcoin Struggling to Break Higher?
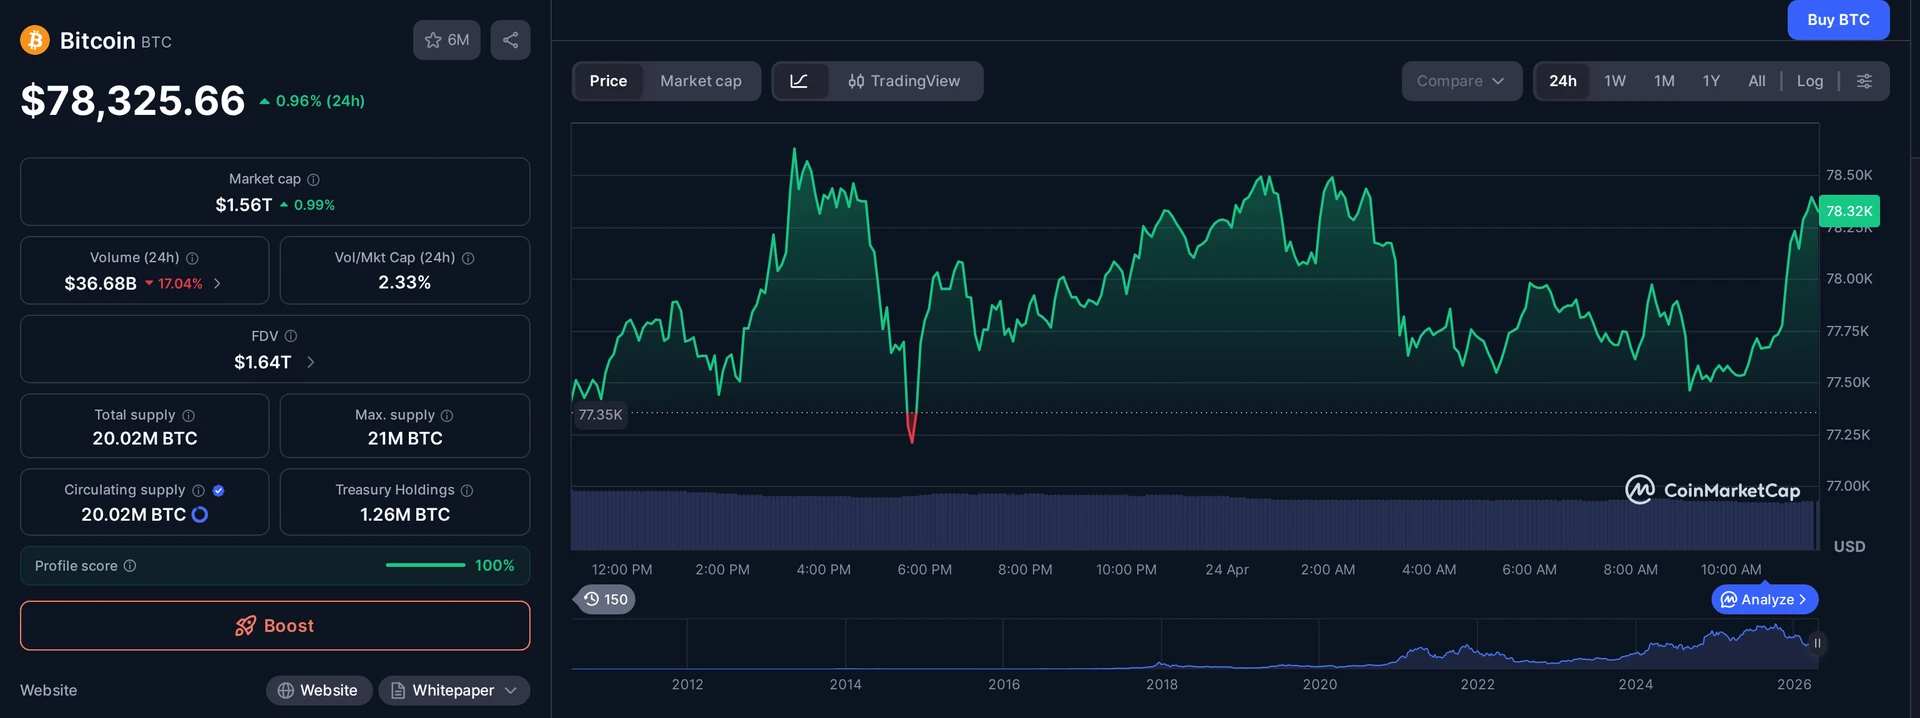
Bitcoin’s rally stalled after tagging highs above $79,000 on Wednesday. Since then, DXY has bounced from its April 17 low of 97.63 back to 98.75. That’s a small move in absolute terms. For a market trading at -0.90 correlation, it’s the whole story.
The macro backdrop isn’t helping. Oil has climbed for five straight sessions. Tanker traffic through the Strait of Hormuz oil chokepoint remains disrupted, and the U.S.-Iran standoff over ceasefire terms keeps the geopolitical premium stuck inside the crude price. Higher oil keeps the inflation conversation alive. Alive inflation keeps the dollar bid. A bid dollar, per the math above, keeps BTC on the back foot.
It’s a chain reaction, and bitcoin is the last link.
What Is Holding Bitcoin Up Then?
One word: ETFs. Sustained inflows into the U.S.-listed spot bitcoin ETFs, which the SEC cleared in January 2024, are absorbing sell pressure from long-term holders. Without that bid, the price action would look a lot uglier than it does.
The Scaramucci Take: Don’t Hold Your Breath Until Fall
Industry leaders are not exactly high-fiving. In a recent interview, Scaramucci said a meaningful recovery in bitcoin may not arrive until October or November. The SkyBridge Capital founder ties that timeline to BTC’s four-year reward halving cycle, where post-halving price expansion historically shows up several months after the event, not immediately.
His other point is more uncomfortable for the bulls. Whales and long-time holders, he said, have been selling into ETF-driven demand. The ETFs are soaking up coins. The old money is handing them over. That’s not necessarily bearish, it’s how a maturing market changes hands. But it is a reason prices aren’t exploding despite the inflows.
Call it the boring phase. Spot demand is real, sell pressure is real, and the two are cancelling each other out while macro sits on the scale.
Whales and long-term holders have continued to sell into ETF-driven demand.
Ether Is Having a Worse Week Than Bitcoin
If you think BTC looks tired, look at ether. The ETH/BTC ratio fell nearly 3% this week to 0.02965, its lowest print since March 15. That’s a textbook breakdown, and it carries two ugly signals.
First, the ratio has broken below the short-term ascending channel that had been guiding ether’s recovery from the early February lows. Second, it’s now trading under the broader downtrend line that has defined the pair since August. Both technical levels were acting as support. Both are gone. Data on ether underperforming bitcoin across exchange flow and derivatives metrics suggests this isn’t a one-week quirk, it’s a regime.
Translation for your portfolio: if you’re overweight ETH versus BTC, the chart is telling you to at least know why.
- ETH/BTC ratio: 0.02965, lowest since March 15
- Weekly move: down nearly 3%
- Broken: short-term ascending channel from February lows
- Broken: August downtrend line
- Implication: continued ether underperformance likely
Where Does That Leave Traders Right Now?
Watching the dollar. That’s the short answer, and at -0.90 correlation, it’s close to the only answer that matters over the next two weeks. If DXY rolls back toward 97.63, bitcoin gets room to run at $79,000 again. If the dollar pushes through 99, the path of least resistance for BTC is sideways to lower.
The longer answer is that this correlation regime won’t last forever. A -0.90 reading is an extreme. Extremes mean-revert. At some point a bitcoin-specific catalyst, another wave of ETF inflows, a regulatory green light, a sovereign buyer headline, breaks the pair’s lockstep. Until then, traders are basically trading the dollar with extra steps.
Scaramucci’s October-to-November call isn’t a price target. It’s a patience target. And patience, right now, is the rarest commodity in crypto.
Frequently Asked Questions
What does a -0.90 bitcoin dollar inverse correlation mean?
A -0.90 correlation means bitcoin and the Dollar Index move in near-perfect opposition. When the dollar rises, bitcoin tends to fall, and when the dollar weakens, bitcoin tends to rally. A reading of -1.00 would be a perfect mirror. At -0.90, the two are about as locked as non-identical assets get.
Why is the Dollar Index so important for bitcoin right now?
With roughly 81% of bitcoin’s short-term price moves statistically tied to the Dollar Index, the greenback has become the dominant macro driver for BTC. Oil prices, Strait of Hormuz tensions, and U.S.-Iran ceasefire talks are all feeding into dollar strength, which in turn caps bitcoin’s upside on a near-daily basis.
When does Anthony Scaramucci expect a bitcoin recovery?
Anthony Scaramucci, founder of SkyBridge Capital, said bitcoin may not see a meaningful recovery until October or November 2026. He tied the timeline to BTC’s four-year halving cycle, where price expansion historically arrives several months after the halving rather than immediately following the event.
Why is ether underperforming bitcoin this week?
The ETH/BTC ratio fell nearly 3% to 0.02965, breaking below both a short-term ascending channel from February and the broader August downtrend line. Losing both technical levels in the same week signals continued ether weakness relative to bitcoin, with traders positioning for further consolidation in the pair.
This article is for informational purposes only and does not constitute investment advice. Every investment and trading decision involves risk. Readers should conduct their own research before making any financial decisions.