










































What to Know
- $1,517, Ethereum’s intraday low on June 26 as the weekly selloff deepened
- $260 million in net outflows from U.S. spot Ethereum ETFs recorded this week alone
- Three whale tiers holding 1,000 to 100,000+ ETH are now in unrealized loss territory for the first time since 2019
- A daily close below $1,500 would open the door to a deeper drop toward $1,414
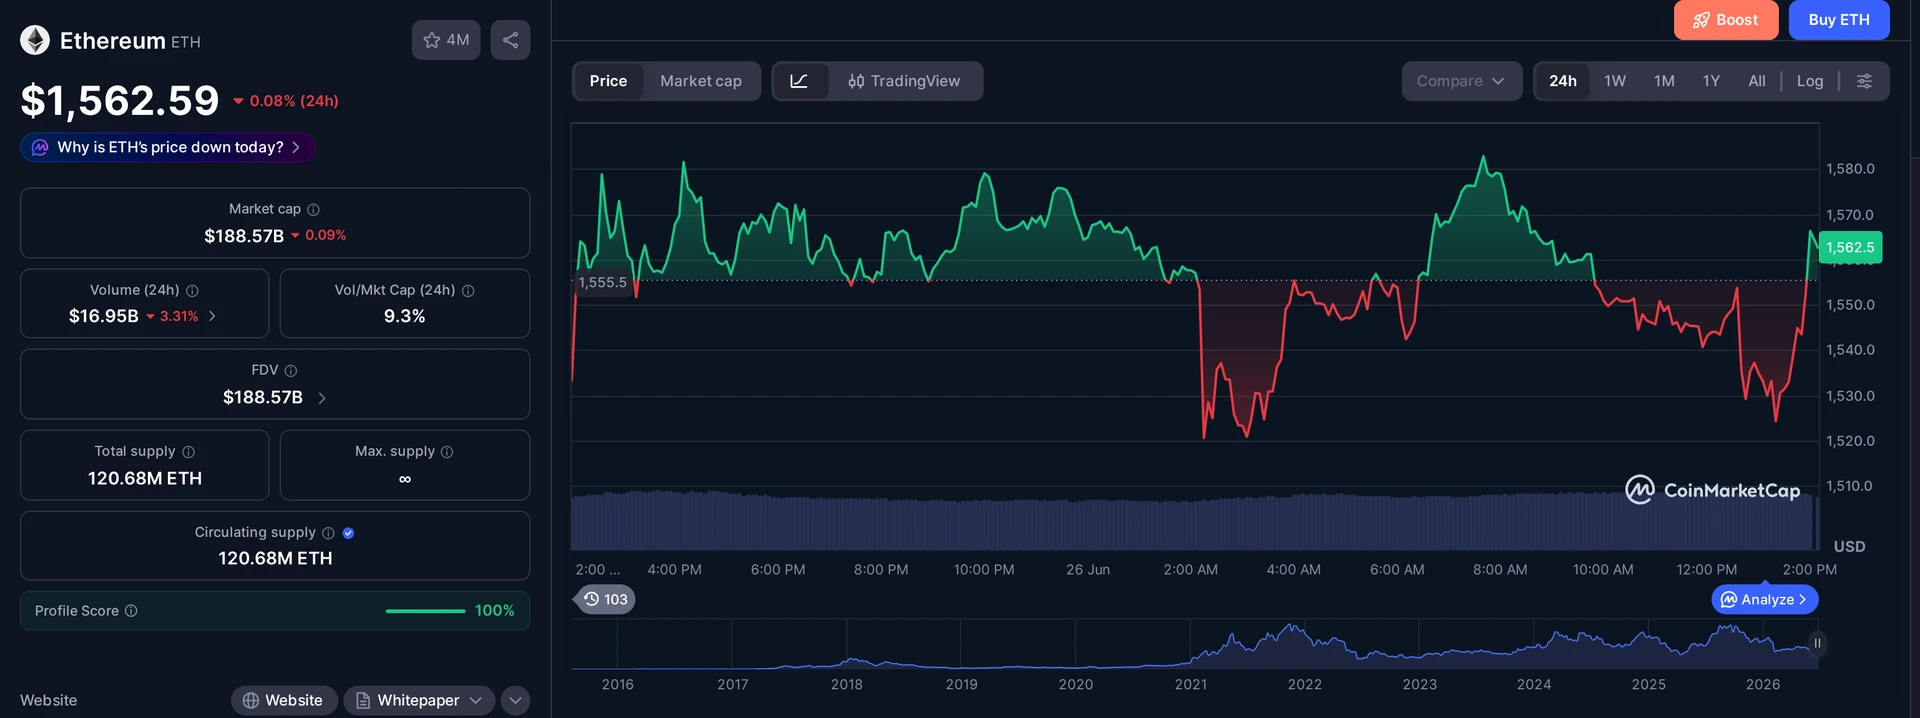
Ethereum ETF outflows hit roughly $260 million this week as ETH slid to an intraday low of $1,517 on June 26, dragging the asset more than 14% below its June 22 peak of $1,773. Institutional selling, a wave of long liquidations, an Ethereum Foundation restructuring, and a hawkish Federal Reserve backdrop have all converged at the worst possible moment, and the $1,500 floor is the only thing standing between Ethereum bulls and a more damaging breakdown.
What Is Driving Ethereum Below $1,550?
The drop started losing steam around $1,500 but the path there was fast. Ethereum fell roughly 7% to $1,517 on June 26 before buyers stepped in and pushed the price back toward $1,550 by press time. The asset has now shed 14.4% from its June 22 high of $1,773 in just four days.
Several forces hit at the same time. First, Ethereum lost its 200-day moving average near $1,668, a technically significant breach that triggered a cascade of used long liquidations. When those longs get wiped out in bulk, price drops fast and hard, which is exactly what happened here.
Then came the Ethereum Foundation 20% workforce reduction, which confirmed the organization is cutting 54 jobs and slashing its operating budget by 40%. The announcement rattled already nervous traders who were watching the $11 billion options expiry loom over the market. Combined with U.S. macroeconomic pressure, specifically expectations of three Federal Reserve rate hikes still ahead, the setup was ripe for a flush.
None of these factors alone would have sent ETH to $1,517. Together, they did.
ETH tapped the lows again. The momentum is still weak due to market correction. But if Ethereum manages to reclaim the $1,750 level from here, we could see a relief rally next month.
Ethereum ETF Outflows Are Accelerating Fast
The institutional side of the story deserves a closer look. According to US spot Ethereum ETF outflows data, U.S. spot ETH ETFs recorded approximately $260 million in net outflows this week, a sharp jump compared to recent weeks. That is not noise. That is a directional signal from the funds that supposedly represent long-term conviction in Ethereum.
The timing matters. Institutions reduced exposure ahead of what they clearly see as a higher-for-longer interest rate environment. When risk appetite shrinks and the dollar strengthens, Ethereum tends to be one of the first assets that gets trimmed from portfolios. The ETF wrapper makes it easier than ever to do exactly that, and apparently that is what happened.
Rising U.S. Treasury yields compound the problem. Higher yields lift the opportunity cost of holding non-yielding assets like Ethereum, making the relative value case harder to argue. If ETF outflows continue at this pace next week, the $1,500 level will face sustained pressure rather than just a brief test.
Whale Losses Are Now the Worst Since 2019
Here is the part of this story that does not get enough attention. CryptoQuant analyst Darkfost tracked unrealized profit ratios across three major Ethereum whale cohorts and the numbers are genuinely alarming. According to Darkfost’s CryptoQuant ETH whale unrealized losses analysis, holders with 1,000 to 10,000 ETH are sitting at a ratio of -0.26, those in the 10,000 to 100,000 ETH range show -0.21, and wallets holding more than 100,000 ETH are at -0.05.
All three groups are underwater. That has not happened since 2019. Not during the 2022 bear market. Not during the 2020 crash. Right now, in June 2026, the largest Ethereum holders are carrying losses that rival some of the darkest chapters in the asset’s history.
Darkfost added some historical context that is worth holding onto. Similar whale stress periods in the past have tended to appear near major bottom zones rather than at the start of extended downtrends. That does not guarantee a bounce, but it does suggest the current price range has historically attracted buying interest from long-term holders. The phrase Darkfost used, ‘fairly resilient’, is probably the most optimistic thing one can say about Ethereum right now.
What Do the Charts Say About ETH Recovery?
Technically, Ethereum’s daily chart is not pretty. The asset broke below the $1,805 support area, which has flipped into resistance. The next major support zone sits near $1,414, and the current bounce from $1,500 to $1,520 has been shallow. Buyers defended the floor but have not shown the strength needed to convincingly hold it.
On the four-hour chart, Ethereum has been grinding lower inside a descending channel since its June 15 peak of $1,849. Fibonacci retracement levels show immediate resistance at $1,584, then $1,641, $1,681, and $1,720. A credible recovery effort would need a clean close above $1,750, a level that also aligns with what traders are watching as the key reclaim target.
Momentum indicators are not helping the bull case. The four-hour RSI sits near 35, borderline oversold but not flashing a reversal signal yet. The MACD on that timeframe remains below zero, though the histogram has started to flatten, suggesting the sharpest part of the selloff may be done. On the daily chart, the Aroon Down sits at 100% while Aroon Up is near 21%, a setup that firmly favors sellers in the short term.
CoinGlass liquidation heatmap data shows two interesting clusters. Above the current price, heavy use concentrates around $1,590 to $1,610 and a larger pocket near $1,660. A push through those zones could trigger short liquidations and fuel a move toward $1,700 and eventually $1,750. Below spot, the heatmap shows concentrated interest around $1,520 and $1,500. A confirmed break below that band would expose the $1,464 to $1,414 region, the next real support on the daily chart.
Where Does Ethereum Go From Here?
The bull case is narrow but it exists. Ethereum would need to reclaim $1,750 first, then clear $1,805 to build any credibility that the June selloff was a liquidity-driven flush rather than the opening move of something worse. Ted Pillows set that same target explicitly, suggesting a potential relief rally in July if buyers can get back above $1,750.
The bear case is more straightforward. A daily close below $1,500 would damage the tentative double-bottom structure forming at the lows and open the door to $1,414. If the Federal Reserve signals more aggressive rate hikes, Treasury yields keep climbing, the U.S. dollar strengthens further, and ETF outflows continue, each of those adds another layer of pressure on a market already carrying serious whale losses.
The market is currently stuck between forced selling below $1,600 and short-covering risk above $1,660. That is a tight window. Something has to give, and the direction of that break will define whether June ends as a painful correction or the start of a deeper bear leg for Ethereum.
Frequently Asked Questions
Why are Ethereum ETF outflows rising in June 2026?
U.S. spot Ethereum ETFs saw roughly $260 million in net outflows this week as institutional investors reduced exposure ahead of expected Federal Reserve rate hikes. Higher interest rates reduce risk appetite, and Ethereum ETF holders appear to be trimming positions in response to a tighter macroeconomic environment.
What is the key support level for Ethereum right now?
The critical support level is $1,500. Ethereum dropped to $1,517 on June 26 before buyers stepped in. A confirmed daily close below $1,500 would weaken the current double-bottom structure and increase the probability of a move toward the next support zone at $1,414.
What did the Ethereum Foundation workforce reduction mean for ETH price?
The Ethereum Foundation announced a 20% staff cut of 54 jobs and a 40% budget reduction in June 2026. The move added selling pressure on ETH by raising concerns about the network’s development pace, landing during an already volatile week with an $11 billion options expiry.
Are Ethereum whale losses really the worst since 2019?
Yes, according to CryptoQuant analyst Darkfost. All three tracked whale cohorts, holding 1,000 to 10,000 ETH, 10,000 to 100,000 ETH, and over 100,000 ETH, now show negative unrealized profit ratios. This has not occurred simultaneously since 2019, not even during the 2022 bear market.
This article is for informational purposes only and does not constitute investment advice. Every investment and trading decision involves risk. Readers should conduct their own research before making any financial decisions.


















$260M in outflows but ETH only at $1,517 tells me there’s still real bid underneath, otherwise we’d be looking at sub-1400 already. The whale capitulation is the part I’d watch closer than the ETF flows honestly.
1500 holds or we revisit 2022 lows, simple as that
anyone else remember the June 2022 Celsius unwind? same vibe with whales bleeding into a thin bid, except now we have ETF redemptions piling on top. curious if anyone is tracking which addresses are actually realizing losses vs just rotating into staked positions