











































What to Know
- Bitcoin bounced from the 20-day EMA near $72,832, with bulls targeting a rally to $84,000 and a pattern measurement of $92,000.
- US spot BTC ETFs pulled in $996 million in inflows last week, the strongest weekly haul since early January.
- Michael Saylor’s Strategy scooped up 34,164 BTC for $2.54 billion between April 13 and April 19, lifting total holdings to 815,061 BTC.
- The S&P 500 (SPX) printed a fresh record at 7,147 while the dollar index cools inside a tight 95.55 to 100.54 range.
Bitcoin price prediction chatter on 4/20 reads bullish on paper and nervous in the order books. BTC bought the weekend dip. Spot ETFs just had their best week since January. And Michael Saylor keeps hitting the buy button like the halving never ended. Yet the $80,000 ceiling still hasn’t broken, altcoins are stuck in neutral, and the clock is ticking on a US-Iran ceasefire that could erase the whole rally if talks collapse on Wednesday. Here’s the chart-by-chart read across the majors.
Why Is Bitcoin Stuck Under $80,000?
Short answer: sellers stacked at the $76,000 to $78,333 zone refuse to budge, and the bulls haven’t produced the daily close needed to flip that supply into support. That’s the whole Bitcoin price prediction story for now. Everything else is commentary on the same setup.
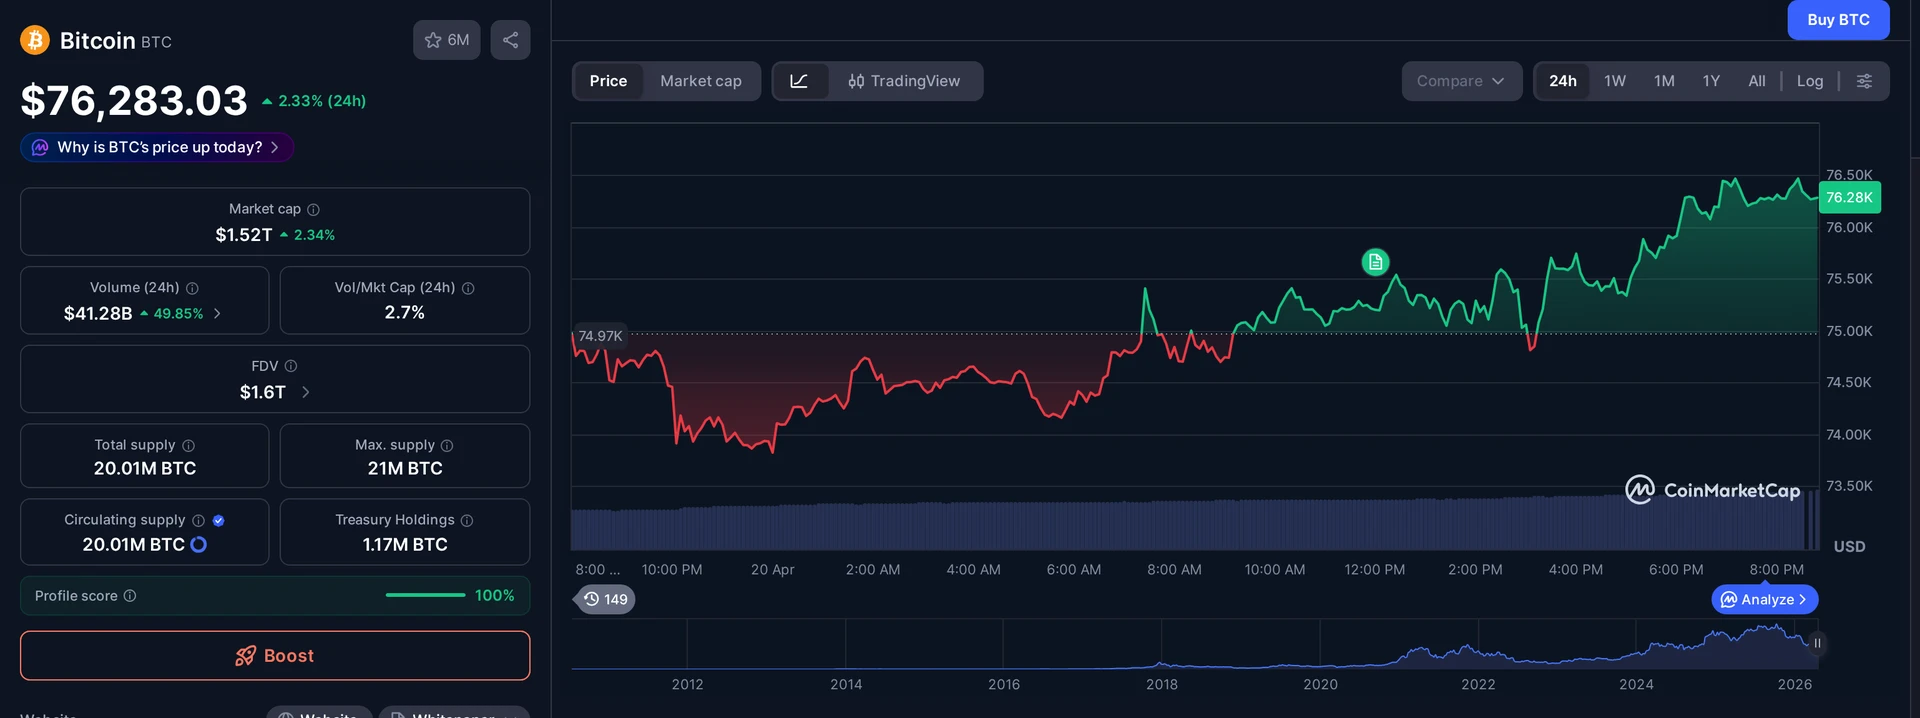
BTC has bounced cleanly off the 20-day exponential moving average around $72,832, and that bounce matters. It tells you the dip-buyers showed up with conviction, not hesitation. According to SoSoValue data, US spot Bitcoin exchange-traded funds absorbed $996 million last week, the strongest weekly intake since the first week of January.
Still, the bears have a job. They want to yank price back below the moving averages and turn this relief rally into a lower high. If they do, the breakout thesis dies. If they don’t, and BTC prints a daily close above the overhead zone, the path opens to $84,000 first and a measured pattern target at $92,000.
Intensifying hostilities could unwind the bullish action over the past few weeks.
Strategy Adds Another 34,164 BTC to the Pile
While traders argue about resistance levels, Strategy keeps quietly absorbing supply. The Michael Saylor-led treasury firm disclosed in an 8-K filing with the US Securities and Exchange Commission on Monday that it bought 34,164 BTC for $2.54 billion between April 13 and April 19.
That pushes the company’s stack to 815,061 BTC acquired for a cumulative $61.56 billion. Call that conviction, call it stubbornness, either way it’s real demand that doesn’t care about a weekend wick.
The broader implication for Bitcoin price prediction models is simple: every week Strategy buys is another week the float tightens while retail waits for a cleaner entry. That’s the backdrop behind every chart below.
SPX Index and DXY Set the Risk Tone
The S&P 500 index (SPX) ripped to a fresh all-time high of 7,147 on Friday. A nice number for equity longs. A warning sign for tactical traders, because the relative strength index punched into overbought territory.
First support on any pullback sits at the 7,002 breakout level, followed by the 20-day EMA near 6,828. A bounce off that EMA would confirm the uptrend is still healthy. A slice through it would tell you the rally finally needs a proper rest.
The US Dollar Index tells the mirror version of that story. DXY turned down hard from the 20-day EMA at 98.73 on April 13 and dropped to 97.74 by Friday. It’s trying to bounce, but the 20-day EMA looks likely to swat it back. The cleanest read: DXY stays pinned inside a 95.55 to 100.54 range until one side breaks.
- SPX upside target if breakout holds: new highs above 7,147
- SPX downside pivots: 7,002, then 6,828 (20-day EMA)
- DXY range: 95.55 floor, 100.54 ceiling
- Next trending move for DXY triggers on a close outside that band
Ethereum and BNB: Range Traders Still in Charge
Ethereum buyers tried to muscle Ether above $2,415 on Saturday and got shoved back to the 20-day EMA near $2,252. That’s the level bulls now have to defend. Lose it on a daily close and the ETH/USDT pair slides back into the $1,916 to $2,415 box for more chop.
Win back $2,415 on a close, and the march to $2,800 opens up fast. Simple trigger, simple invalidation, and right now the tape favors neither side decisively.
BNB looks even more mechanical. The token is oscillating between $570 and $687, with flat moving averages and an RSI glued near the midpoint. A break above $650 points to $687. A slip below the 20-day EMA aims back at $570. The next genuine trending move needs a daily close outside either edge of that range.
Buyers will have to fiercely defend the 20-day EMA and secure a close above the $2,415 level to signal the resumption of the relief rally.
XRP, Solana, DOGE: Who Breaks First?
XRP has been grinding between $1.27 support and $1.61 resistance for days. The moving averages are flat. The RSI is parked just above midline. That’s a setup that usually resolves with a sharp move, not a gentle drift. Buyers need a close above the descending trendline to aim at $2. Sellers want a break of $1.27 to unlock a slide to $1.11 and the lower channel line.
Solana is the weaker chart of the trio. SOL fell below its moving averages on Sunday, handing sellers the short-term edge. If price stays capped under the averages, bears will press toward $76 support. Reclaiming $90 is the bullish trigger, and a close above $98 would open a run toward $117.
Dogecoin rolled over from the $0.10 psychological level on Friday and is now leaning on its moving averages. Lose the averages and $0.09 comes into play, with $0.08 and $0.06 waiting below. Reclaim $0.10 and hold it, and DOGE can grind toward $0.12, where bears typically wake up.
- XRP: bull trigger close above descending trendline; target $2
- XRP: bear trigger close below $1.27; next stop $1.11
- SOL: reclaim $90 for shot at $98 and $117
- SOL: lose averages for slide to $76
- DOGE: hold $0.10 for push to $0.12
- DOGE: lose averages for leg to $0.09, then $0.08
HYPE and ADA Tell the Altcoin Weakness Story
Hyperliquid slipped back below its breakout level at $43.76 after holding above it for several sessions. The bulls are now trying to stop the bleed at the 20-day EMA near $41.03, but the bears are leaning in. Lose that EMA and the next magnets are the 50-day SMA at $38.09 and then $34.45.
A bounce off the EMA keeps the bullish story alive. Reclaim $45.77 and HYPE/USDT can run toward the $50 to $51.43 zone, where the real fight begins.
Cardano popped above the 50-day SMA near $0.26 on Friday and immediately gave it back, slipping below $0.25 on Saturday. Sellers now want a break of $0.23 to reopen the downtrend toward $0.22 and the channel support. Buyers need a close above the downtrend line to flip the structure, which would project moves to $0.32 and $0.37. Right now, the ADA chart is closer to cracking than breaking out.
What the 4/20 Tape Means for Your Bitcoin Price Prediction
It means patience. The Bitcoin price prediction case for $84,000 and eventually $92,000 is alive, but only if BTC clears the $76,000 to $78,333 supply on a daily close. Until then, altcoins trade sideways at best, and the weakest charts (SOL, ADA, HYPE) risk fresh lows if the ceasefire story breaks wrong.
The bullish tells are real. Spot ETF demand just had its best week since January. Strategy is still buying in nine-figure chunks. Equities are printing records. That’s the kind of macro tailwind that usually drags crypto higher, not lower.
The bearish tell is the calendar. A Wednesday deadline on the US-Iran ceasefire is the wildcard. If it extends, the tape probably grinds higher into month-end. If it collapses, every chart above flips to its downside scenario in a hurry. Position accordingly.
Frequently Asked Questions
What is the Bitcoin price prediction for April 20?
Bitcoin is bouncing off the 20-day EMA near $72,832, with buyers defending the dip. A daily close above the $76,000 to $78,333 resistance zone opens the path to $84,000 and a pattern target of $92,000. A rejection from that overhead zone keeps BTC rangebound below $80,000.
How much Bitcoin did Strategy buy this week?
Michael Saylor’s Strategy disclosed a purchase of 34,164 BTC for $2.54 billion between April 13 and April 19, according to an 8-K filing with the US Securities and Exchange Commission. The buy lifts Strategy’s total holdings to 815,061 BTC acquired for a cumulative $61.56 billion.
Why does the SPX index matter for crypto?
The S&P 500 index sets the risk appetite for global markets. SPX just printed a fresh all-time high at 7,147, and its 20-day EMA near 6,828 acts as a pivot for the broader uptrend. When SPX is strong, crypto typically benefits from spillover risk-on flows and softer dollar pressure.
What are the key levels for Ethereum and Solana?
Ethereum needs a daily close above $2,415 to target $2,800, with the 20-day EMA near $2,252 as key support. Solana must reclaim $90 and then $98 to open a run at $117. A breakdown below the moving averages points SOL toward $76 support on the downside.
This article is for informational purposes only and does not constitute investment advice. Every investment and trading decision involves risk. Readers should conduct their own research before making any financial decisions.


















If BTC fails to hold above 82k the next leg down targets the 78k gap from early April. Curious why the piece leans bullish on $84k when DXY is still showing strength on the daily.
sol wobbling below 90 again, feels like every other week at this point
ETH defending 2252 is the only thing keeping my portfolio breathing right now. if that flips to resistance we’re cooked all the way to 2080.
anyone else watching the BNB/BTC ratio here? it’s been quietly grinding up while everyone stares at SOL and HYPE. wondering if that’s a real rotation signal or just noise.
Seen this exact setup in 2019 and again in late 2021, range-bound BTC while alts bleed slowly, then one violent wick takes out both sides of the liquidity before the real move. Patience pays, leverage doesn’t.
DOGE and ADA in the same breath as SPX and DXY is a wild combo for one chart read.