











































What to Know
- XRP is trading at $1.44, up 1.6% in 24 hours and 5% on the week after a 28% bounce off the $1.12 macro low
- The average XRP holder is back in profit after the token reclaimed its realized price of $1.41
- A symmetrical triangle on the XRP/USD chart projects a measured move of 55% to $2.24 if bulls close above $1.46
- Key resistance stacks at the 111-day MA ($1.57), 200-day MA ($1.88) and 365-day MA ($2.22)
The XRP price has done something it has not managed in months. It pulled the average holder out of the red. After a 28% grind higher from the $1.12 macro low, XRP is changing hands at $1.44 and now sits just above the cost basis of every coin currently in circulation. Traders who spent the winter watching their bags bleed are finally back above water, and the chart is starting to hint at something louder.
XRP Price Reclaims the Level That Actually Matters
Forget round numbers for a second. The level that flipped the mood on XRP is not $1.50 or $2. It is $1.41. That is the realized price, the on-chain average cost basis of every coin based on when it last moved. When spot trades above that line, the aggregate holder base is in profit. When it trades below, the average wallet is underwater.
XRP just crossed back over. The XRP price is up 1.6% in the past 24 hours and roughly 5% over the week, putting it comfortably north of the realized band. That matters more than a simple price tick. It rewires the psychology of the market. Underwater holders sell rallies because they want out at break-even. Profitable holders sit on their bags because the clock is finally working for them.
The moving averages between $1.35 and $1.40 need to be held to keep the bullish outlook in play.
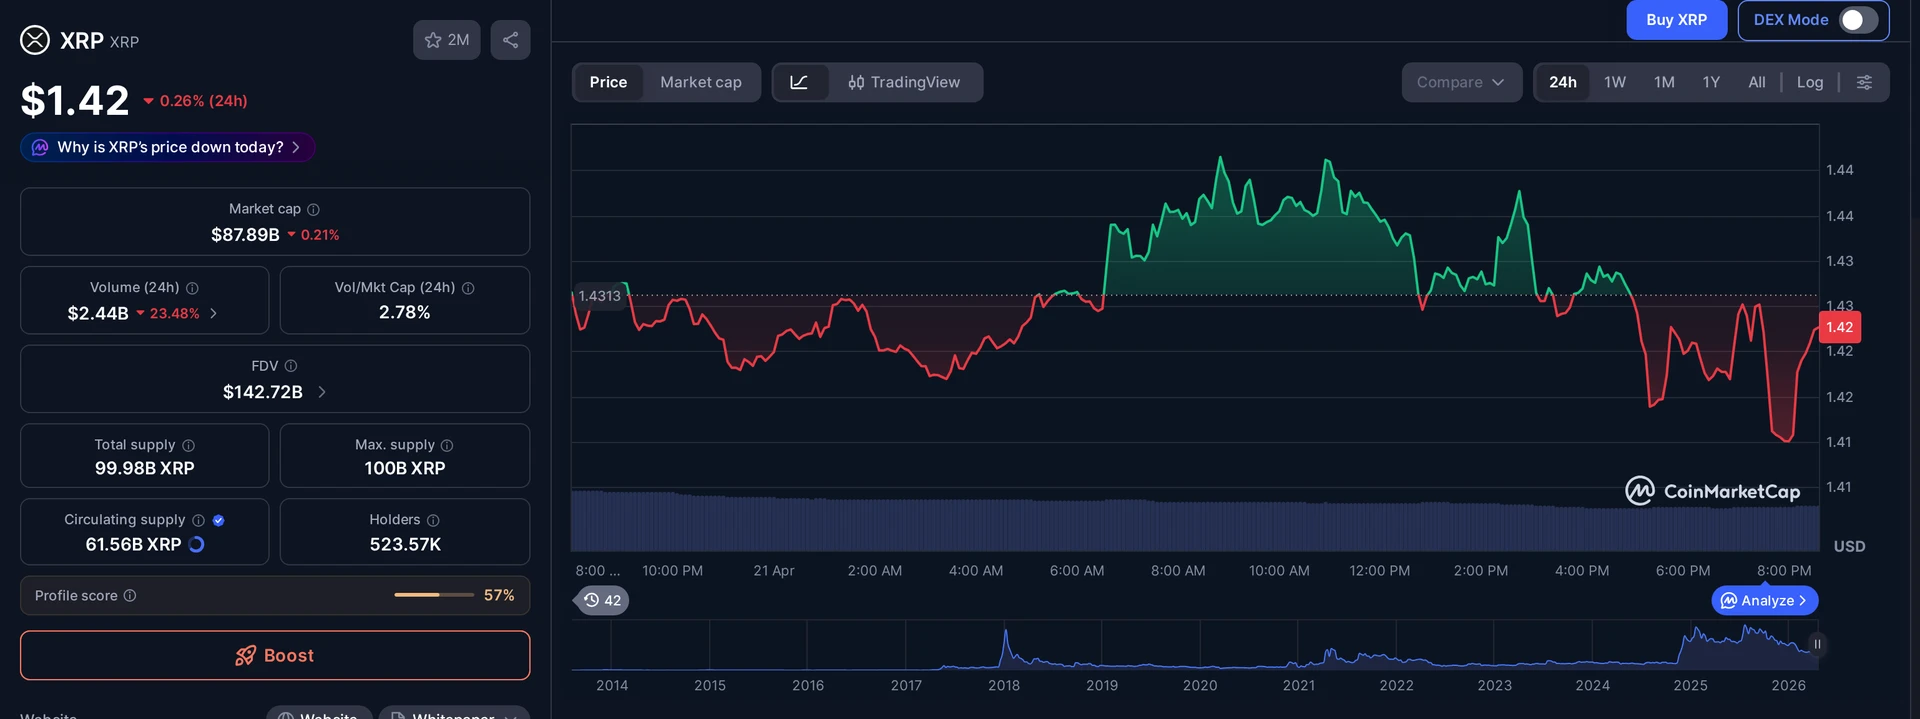
What Does the Realized Price Tell Us About Holder Behavior?
The realized price is a cost-basis metric, not a technical level. It tracks the value of every XRP at the time of its last on-chain move, then averages those costs into a single number. Right now that number sits at $1.41. Think of it as the market’s breakeven line.
History says crossing this line is not a small event. The last time XRP clawed above its realized price after sitting beneath it for months was in mid-2024. What followed was not a modest bounce. Spot went from $0.52 to $2.90, a 460% rally that turned capitulation into euphoria in a matter of weeks. That is not a guarantee the same setup repeats. But it is the reason long-term holders are paying attention this time.
The Symmetrical Triangle and the 55% Target
On the XRP/USD chart, XRP has been grinding inside a symmetrical triangle for more than two months. The pattern is textbook: a series of lower highs meeting a series of higher lows, coiling into an apex. Traders love these setups because they resolve in one direction with force.
The upper trendline of the triangle sits near $1.46. A daily close above that level opens the measured-move target, calculated by stacking the triangle’s vertical height on top of the breakout point. That number is $2.24, a 55% move from current spot. It is not a prediction. It is the geometry of the pattern. Whether buyers show up to collect it is the only question that matters.
On the downside, losing the $1.35 to $1.40 zone kills the thesis. That band houses the short-term moving averages analysts are watching as the last line of defense. Slip beneath it and the average holder flips back into loss, sell pressure returns, and the triangle resolves the wrong way.
- $1.46, upper trendline of the triangle, the breakout trigger
- $1.57, 111-day moving average, first resistance above
- $1.88, 200-day moving average, medium-term pivot
- $2.22, 365-day moving average, the yearly mean
- $2.24, measured move target from the triangle pattern
Why Bulls Still Have Something to Prove
Here is the cynical read. Reclaiming the realized price is a necessary condition for a sustained rally, not a sufficient one. Crossing back above cost basis tells you the floor is firmer. It does not tell you the ceiling is weaker. And XRP’s ceiling is heavy.
Above the triangle sits a descending parallel channel that has capped every rip since February. Bulls need a daily candlestick close above the upper trendline of that channel at $1.60 to confirm a real trend change, not just a relief bounce inside the broader downtrend. Anything short of that is a lower-timeframe squeeze dressed up as a reversal.
The 111-day MA at $1.57 is the first test. If buyers can flip that into support, the path to the 200-day at $1.88 opens. Lose $1.40 instead and the conversation changes entirely. That is the part traders keep glossing over in the rush to price in the $2.24 target.
What This Means for XRP Holders Right Now
If you have been holding XRP through the drawdown, the arithmetic just got easier. The average wallet is green again, even if individual entry points vary wildly. That is a psychological reset, and in crypto, psychology often leads price.
For traders sizing new positions, the levels are clean. Entry risk lives below $1.40. The invalidation is tight. The upside to the measured move is roughly four times the downside to the invalidation. That is the kind of setup technicians build books around, with the obvious caveat that setups fail all the time.
The broader altcoin tape is still choppy, and XRP does not trade in a vacuum. A Bitcoin wick lower drags every major alt with it, triangle or no triangle. But for the first time in months, XRP holders are not defending a losing position. They are deciding how much size to add on a breakout.
Frequently Asked Questions
What is the current XRP price on April 21, 2026?
XRP is trading at $1.44 on April 21, 2026, up 1.6% over the past 24 hours and roughly 5% on the week. The token has rebounded 28% from its macro low at $1.12 and now sits above its realized price of $1.41, putting the average holder back in profit.
Why does the XRP realized price at $1.41 matter?
The realized price is the on-chain average cost basis of every XRP in circulation. When spot trades above it, the aggregate holder base is in profit. Crossing back over $1.41 reduces forced selling from underwater wallets and historically has preceded major rallies, including a 460% move from $0.52 to $2.90 in mid-2024.
What is the XRP breakout target from the symmetrical triangle?
The symmetrical triangle on the XRP/USD chart projects a measured move of 55% to $2.24, calculated by adding the triangle’s height to the breakout point near $1.46. Bulls need a daily close above $1.46 to activate the target, with further resistance at $1.57, $1.88, and $2.22.
What invalidates the bullish XRP setup?
Losing the $1.35 to $1.40 zone invalidates the current bullish structure. That band houses the short-term moving averages traders are watching as support. A daily close below $1.40 would drop the average holder back into loss, revive sell pressure, and likely resolve the triangle pattern to the downside rather than toward the $2.24 target.
This article is for informational purposes only and does not constitute investment advice. Every investment and trading decision involves risk. Readers should conduct their own research before making any financial decisions.


















reclaiming the 1.41 realized price is the part that actually matters here, aggregate cost basis flipping green tends to reduce sell pressure from underwater bags. curious if the author checked whether this flip held on the daily close or just intraday.
a triangle breakout projection to 2.24 sounds clean on paper but these symmetrical setups fail about as often as they work on XRP, especially into BTC weakness. what’s the invalidation level if we lose 1.41 again on volume?
if we actually tag 2.24 on this leg I’m finally back to breakeven from my 2021 bag, been waiting four years for this exact setup
been trading this token since the 2017 run and every XRP breakout gets front run by the same accumulation pattern on the lower timeframes. nothing new, just pay attention to the retest.
volume looks thin on the breakout candle tbh
anyone else watching the April 21 date specifically? is there a catalyst lined up or is it purely technical from the triangle measured move