
What to Know
- U.S. spot bitcoin ETFs logged 8 straight days of inflows totaling $2.10 billion through April 23, per SoSoValue
- BlackRock’s IBIT handled roughly 75% of the April 23 action at $167.49 million, while Fidelity’s FBTC bled $16.93 million
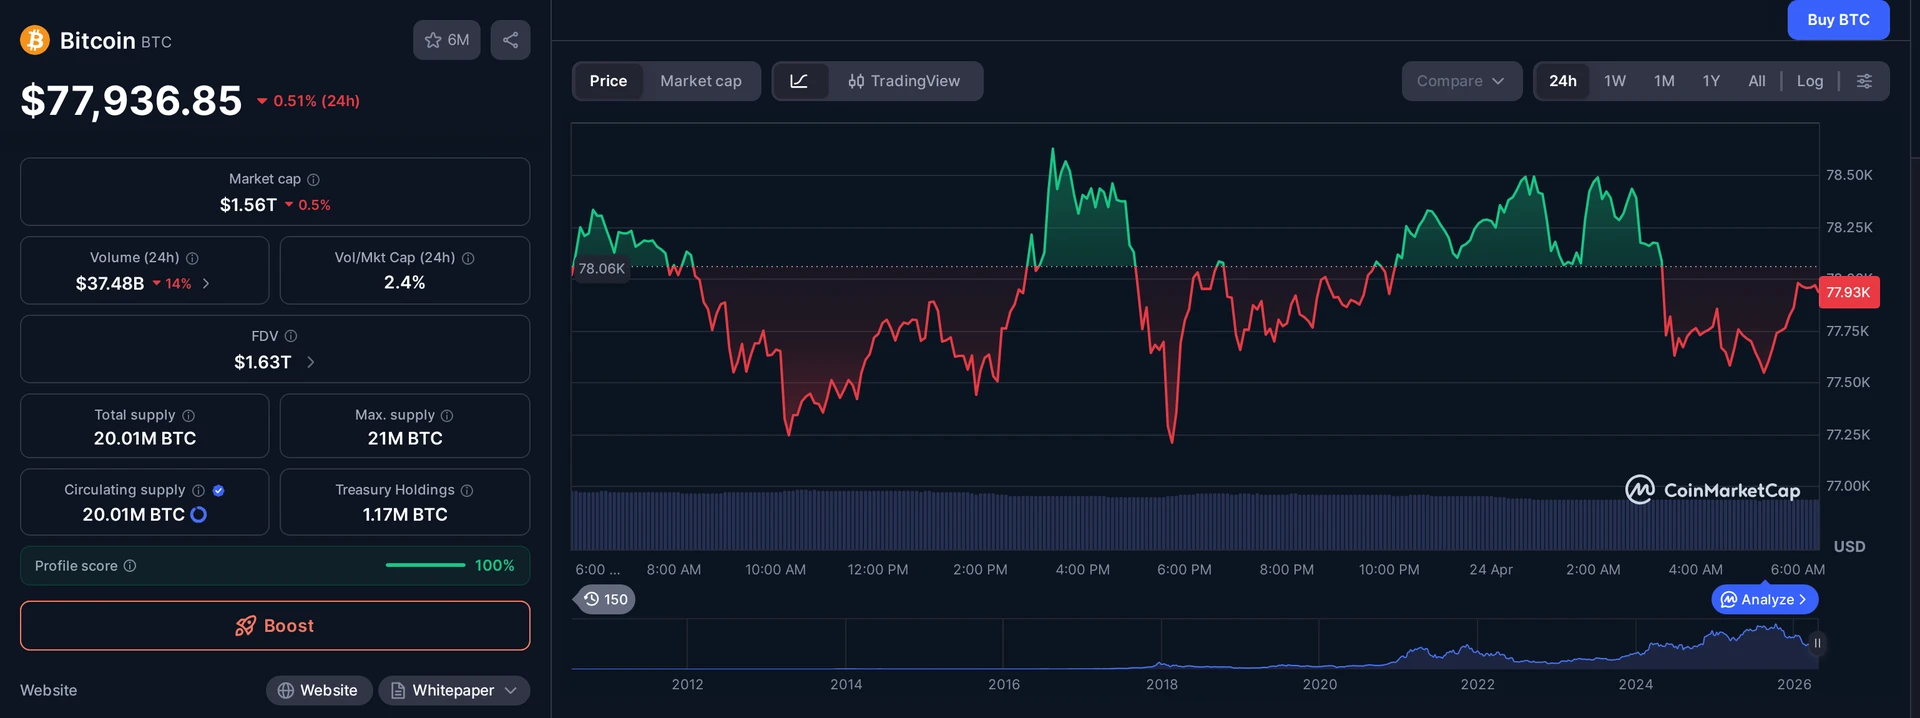
- Bitcoin climbed from $68,000 to $77,000 during the streak, a 12% move that tracks the ETF bid almost perfectly
- Short-term holder realized profit has hit $4.4 million per hour, three times the $1.5 million threshold that preceded every local top this year
The Bitcoin ETF 8-day streak has quietly become the story of April. Someone is hoovering up $2.1 billion of bitcoin through U.S. spot products. Someone else is using that same bid as an exit ramp. Both things can be true, and right now both things are. Spot bitcoin ETFs logged eight consecutive days of net inflows through April 23, the longest run since the nine-day October 2025 streak that carried bitcoin to its $126,000 all-time high. This one has pushed price from $68,000 to $77,000 in lockstep. The question is not whether the money is flowing. The question is who is on the other side of the trade.
Inside the Bitcoin ETF 8-day streak: $2.1 Billion in Context
April 23 alone delivered $223.21 million of net inflows across the eleven U.S. spot bitcoin products, bringing the cumulative eight-day haul to $2.10 billion. That is the kind of number that used to move the market for a week. Now it feels routine. Cumulative net inflows since the January 2024 launch sit at $58 billion, and total assets under management have crossed $102 billion. For context, that is roughly 6.5% of bitcoin’s entire market capitalization parked inside regulated wrappers that did not exist 27 months ago.
The last time the streak counter ran this hot, bitcoin printed a fresh all-time high within days. The October 2025 nine-day run ended with price stapled to $126,000. The pattern this spring looks familiar in shape, if not yet in magnitude. Data from the Bitcoin ETF 8-day streak dashboard shows the bid has come back in a way that does not happen by accident. Someone, or more likely several someones, decided price was cheap below $70,000 and started writing tickets.
BlackRock’s IBIT Is Doing Almost All the Heavy Lifting
Here is the wrinkle nobody talks about enough. The streak is not a broad ETF rally. It is one ticker carrying a pile of laggards. On April 23, BlackRock IBIT inflows accounted for roughly 75% of the day’s total, at $167.49 million. Fidelity’s FBTC printed the only meaningful outflow of the session, losing $16.93 million. The rest of the field split the scraps.
That concentration matters. When one issuer carries a run this lopsided, the streak is only as durable as that issuer’s pipeline. If the desk allocating into IBIT slows down, or if a single large client rotates out, the tape flips fast. We saw it in March, when a seven-day streak snapped the same week price tagged its local high. The current structure is not identical, but the rhyme is loud enough to hear from across the room.
For context, IBIT has absorbed more flow on its own than most of the non-BlackRock field combined since February. That makes IBIT the single most important liquidity variable in spot bitcoin right now. A cooling IBIT is not the same as a cooling bitcoin, but the market tends to conflate the two, and reflexively.
The ETF bid is real. The exit liquidity for short-term holders it provides is also real. Which side wins at $80,000 is worth watching.
Why Is Bitcoin Stuck Just Below $80,000?
Because that is where recent buyers break even, and recent buyers have been waiting months to sell. Bitcoin reclaimed its True Market Mean at $78,100 this week, the first time that level has been taken back since mid-January. Historically, that flip marks the handoff from bear-market conditions to something more constructive. But the next rung up is the wall.
The Bitcoin short-term holder cost basis sits at $80,100. That is the average entry price for anyone who bought bitcoin in the last 155 days. A clean move above it would push more than 54% of recent buyers into profit for the first time in months. In every prior instance this cycle, that same threshold has coincided with local top formation, because short-term holders use the rally to break even and walk. This is the second time the structure has set up this year. The first time, it broke down hard.
Short-Term Holder Distribution Is Already Happening
The selling is not theoretical. Short-term holder realized profit has spiked to $4.4 million per hour on a rolling basis, per Glassnode’s on-chain read. The historical threshold that has preceded every local top year-to-date is $1.5 million per hour. The current reading is roughly three times that. Translation: the coins moving on-chain right now are coins bought recently, and they are moving at a profit into strength.
The cohort doing this is exactly the cohort the ETF bid is designed to absorb. Long-dated holders are not selling in any meaningful size. What you are seeing is the 155-day-or-younger wallets taking the chance to offload into a regulated, deep-liquidity buyer that did not exist two cycles ago. The ETF is not just a new buyer. It is also a new exit door.
That is a genuinely novel market structure. Previous cycles forced short-term holders to dump into retail or into offshore perps, which created the classic blow-off top followed by cascading liquidations. This cycle gives them a clean institutional counterparty. The tops may not look the same.
- Short-term holder realized profit: $4.4 million per hour, three times the historical top threshold of $1.5 million
- True Market Mean reclaimed at $78,100, first time since mid-January
- Short-Term Holder Cost Basis: $80,100, the line that has capped every rally this cycle
- Above $80,100, more than 54% of recent buyers flip into profit at once
The Squeeze Setup: Funding, Shorts, and the Path to $80,000
Funding on bitcoin perpetuals is still negative, which is a fancy way of saying shorts are paying longs to stay in the trade. That is the fuel for a squeeze. Saturday already gave us one, briefly tagging $78,000 before the Hormuz headline reversed it back. A second squeeze, stacked on the ETF bid and the recovering spot demand Glassnode has flagged on offshore venues, is the clean mechanical path to $80,000.
What happens at $80,000 is the whole trade. If the breakout holds against the short-term holder distribution waiting there, you get follow-through into price discovery and eventually a test of the $126,000 highs. If it gets absorbed the way every local top has been absorbed this cycle, you get a retracement that looks a lot like March. The ETF flow data will tell you which side is winning within 48 hours of the break.
The setup is specific and the tell is obvious. Watch IBIT prints on the day bitcoin first closes above $80,100. If the number comes in hot, the distribution is getting absorbed and the uptrend has legs. If IBIT slows while price stalls, short-term holders are winning the tape and the top is probably in for this leg.
What This Means for Investors Right Now
If you are long bitcoin through an ETF or spot, the honest read is that the next $3,000 of upside is the most important price action of the quarter. The ETF bid has proven it will show up. The question is whether it keeps showing up after short-term holders stop selling, or whether the selling is what is generating the flow in the first place. Both scenarios are live. Neither is confirmed.
For traders, the cleanest structure is a break and hold above $80,100 with IBIT printing green on the confirmation candle. For investors, the cleanest structure is whatever lets you sleep. The $102 billion sitting inside U.S. spot bitcoin ETFs is not going anywhere in a week regardless of which way $80,000 resolves. That is the bigger structural story, and it has not changed.
Frequently Asked Questions
What is the Bitcoin ETF 8-day streak?
The Bitcoin ETF 8-day streak refers to eight consecutive days of net inflows into U.S. spot bitcoin ETFs through April 23, totaling $2.10 billion. It is the longest streak since the nine-day October 2025 run that drove bitcoin to its $126,000 all-time high, per SoSoValue data.
How much of the current ETF inflow is coming from BlackRock IBIT?
BlackRock’s IBIT handled roughly 75% of the April 23 net inflow total at $167.49 million out of $223.21 million across all eleven U.S. spot products. IBIT has carried most of the eight-day streak on its own, while smaller issuers posted mixed results and Fidelity’s FBTC recorded the only meaningful outflow.
Why does the Short-Term Holder Cost Basis at $80,100 matter?
The $80,100 Short-Term Holder Cost Basis is the average entry price for anyone who bought bitcoin in the last 155 days. A clean break above it flips more than 54% of recent buyers into profit. In every prior instance this cycle, that threshold has coincided with local top formation as short-term holders sold into the rally.
What signals a successful breakout above $80,000?
Watch IBIT net inflows on the first daily close above $80,100. A hot IBIT print means the ETF bid is absorbing short-term holder distribution and the trend has legs. A soft IBIT print with stalling price suggests short-term holders are winning the tape and a local top is probably in for this leg of the rally.
This article is for informational purposes only and does not constitute investment advice. Every investment and trading decision involves risk. Readers should conduct their own research before making any financial decisions.