
What to Know
- 35 million XRP left exchanges in a single day, the sixth-largest daily outflow of 2026, according to Santiment.
- US spot XRP ETFs logged $82.88 million in net inflows over three weeks, pushing AUM to $1.1 billion.
- A two-year falling wedge points to a target near $1.87 to $1.89, roughly 30% above current levels by June.
- A clean break below the wedge would flip the script and open a path back to $0.98.
A wave of XRP exchange outflows just hit the kind of size that has, three times this year already, preceded a rally. On Saturday, the XRP Ledger recorded nearly 35 million XRP withdrawn from exchanges in 24 hours, the sixth-largest single-day outflow of 2026. That is on top of three straight weeks of inflows into US spot XRP ETFs and a quiet flip in whale behavior that bears watching if you are sitting on a bag.
Why XRP Exchange Outflows Signal a Supply Squeeze
When tokens leave an exchange in size, they typically end up in private wallets or cold custody. Translation: those coins are not coming back to market for a quick sell. The 35 million figure logged on Saturday by XRP exchange outflows data ranks as the sixth-largest daily withdrawal so far in 2026, and the timing is what makes it interesting.
Earlier this year, the same pattern showed up twice and both times the price followed. In March, a comparable spike in withdrawals was followed by a roughly 20% rebound in XRP. The February episode hit harder, with XRP climbing somewhere between 48% and 50% in the weeks after. Two for two is not a guarantee. It is also not nothing.
XRP itself has already rallied more than 30% over the last three months, so this is not a coin trying to claw out of a hole. It is a coin where supply on exchanges keeps thinning while demand signals point in the same direction.
- Saturday outflow: ~35M XRP in 24 hours
- Rank in 2026: sixth-largest single-day withdrawal
- March precedent: ~20% price rebound followed
- February precedent: ~48% to 50% rally followed
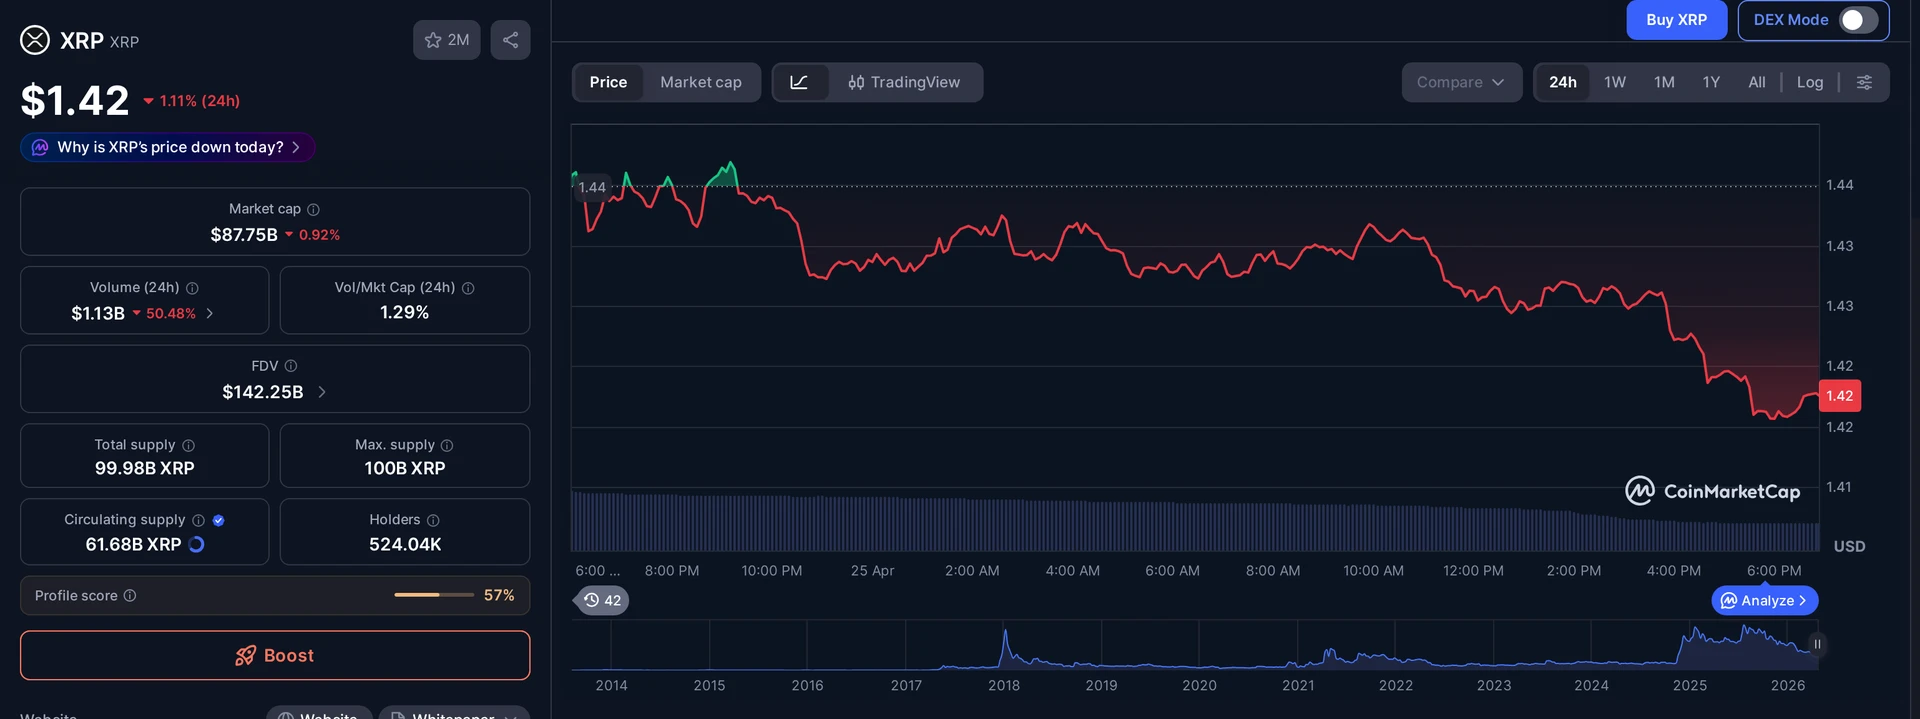
Spot XRP ETF Inflows Build a Second Tailwind
Retail self-custody is one story. Wall Street showing up with a checkbook is another. Per SoSoValue, US-based spot XRP ETF inflows have now logged three consecutive weeks of net positive flows, totaling about $82.88 million as of Saturday. Total assets under management across the products sit at $1.1 billion.
That is not a number that screams mania. It is a number that suggests the ETFs are doing exactly what they were supposed to do: give institutional desks a clean, regulated way to express an XRP view without touching a hot wallet. Three weeks in a row of inflows is the kind of streak that allocators notice.
Combined with the exchange outflows, the picture is consistent. Coins are coming off trading venues. New money is moving into wrappers built for long-term holding. Whoever is buying does not look like they plan to flip on the next 5% pop.
Three for three on the outflow signal would make four. Markets do not owe you a fourth, but the setup is harder to argue with than usual.
Whale Flows Have Quietly Flipped Positive
The third leg of this setup is the one most retail traders miss. According to CryptoQuant, XRP whale accumulation has flipped positive after spending much of early 2026 in the red. The 90-day moving average of XRPL whale flows is back above zero, which means large wallets are now adding rather than dumping.
Whale flow regimes matter because they tend to lead retail by weeks. The last time the 90-day average crossed back into positive territory in a meaningful way, it preceded the May to July 2025 rally that took XRP into one of its better quarters of the cycle. Same indicator. Similar setup. Different year.
Stack the three signals together and you get the same conclusion from three independent angles. Exchange balances are shrinking. ETF buyers are accumulating. Whales are accumulating. None of the three is enough on its own. All three together is the kind of confluence traders pay to see.
What the XRP Falling Wedge Says About a 30% Move
On the chart, XRP has spent the last two years grinding inside an XRP falling wedge defined by two downward-sloping, converging trend lines. The April rebound off the lower trend line is the sort of bounce wedge-watchers wait for, and it raises the odds of a push toward the upper boundary.
The target zone lines up with both the 50-week EMA and the 0.5 Fibonacci retracement near $1.87 to $1.89. From current levels that is roughly a 30% move higher, with June as the rough timing window if the pattern resolves the way bulls expect.
Falling wedges are typically read as bullish reversal patterns once price clears the upper trend line on real volume. The catch, and there is always a catch, is that a wedge only counts when it actually breaks. Until that happens, the bullish read is a thesis, not a trade.
Where Does the Bull Case Break?
A decisive close below the wedge’s lower trend line would invalidate this whole picture. In that scenario, the chart opens up a path toward $0.98, which lines up with the wedge’s apex and the 0.786 Fibonacci line. That is not a small drop from current prices, and any used longs sitting just under support would feel it first.
The other thing worth watching is whether the ETF inflow streak holds. Three weeks of net buying is constructive. A single red week, especially a large one, would cool the institutional read fast. Same goes for the whale 90-day average. Crossings back below zero have historically marked some of the better short setups in XRP.
So the asymmetric trade, if you want to frame it that way, sits in the wedge. A break up targets $1.87 to $1.89 with three on-chain signals at your back. A break down sends the conversation back to $0.98 and resets the entire thesis. Pick your invalidation level before the candle prints, not after.
- Bull target: $1.87 to $1.89 by June (~30% upside)
- Bear target: $0.98 (wedge apex, 0.786 Fib)
- Confirmation: weekly close above the wedge’s upper trend line
- Invalidation: decisive close below the lower trend line
Frequently Asked Questions
What does it mean when XRP leaves exchanges in large amounts?
Large XRP exchange outflows usually mean investors are moving tokens into private wallets or custody, which reduces the supply available to sell on short notice. In 2026, similar withdrawal spikes in February and March preceded XRP rallies of roughly 48% to 50% and 20% respectively, according to Santiment data.
How much have spot XRP ETFs taken in?
US-based spot XRP ETFs have recorded three consecutive weeks of net inflows totaling about $82.88 million, with total assets under management reaching $1.1 billion as of Saturday, per SoSoValue. The streak is read as a sign of growing institutional appetite for regulated XRP exposure.
What is the XRP falling wedge target?
XRP has traded inside a two-year falling wedge, and an April rebound off the lower trend line points toward the upper boundary near $1.87 to $1.89. That zone lines up with the 50-week EMA and the 0.5 Fibonacci retracement, implying roughly 30% upside by June if the pattern resolves bullishly.
What invalidates the bullish XRP setup?
A decisive weekly close below the falling wedge’s lower trend line would invalidate the bullish thesis. In that scenario, XRP would risk a slide toward $0.98, which aligns with the wedge’s apex point and the 0.786 Fibonacci retracement. A break in the ETF inflow streak would also weaken the case.
This article is for informational purposes only and does not constitute investment advice. Every investment and trading decision involves risk. Readers should conduct their own research before making any financial decisions.