What to Know
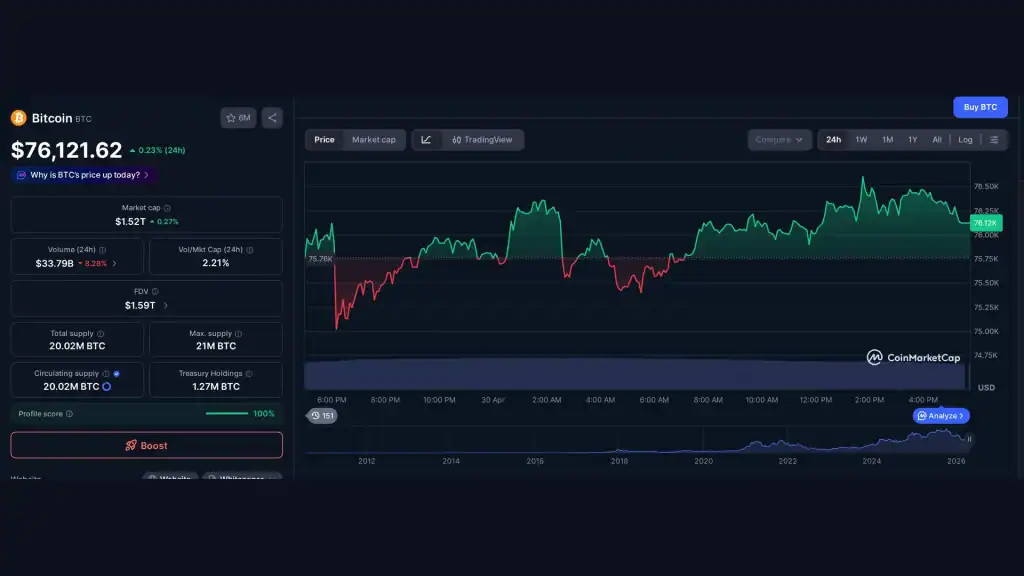
- Bitcoin rallied above $77,900 on April 29 but long wicks on the candle show heavy selling pressure at higher levels
- Analyst Willy Woo gives 30% odds that BTC closes above $79,000 in the current attempt
- XRP slipped below its moving averages Tuesday; a break under $1.27 would put the February low of $1.11 in play
- Solana is pinned in a tight band between $82.65 and $90.73, with a break above $90.73 targeting $98 and then $117
The Bitcoin price prediction landscape heading into the April 29 session looks cautious at best. BTC managed a bounce above $77,900 but sellers showed up hard at higher levels, and on-chain analyst Willy Woo assigned only 30% odds to the recovery closing above $79,000. Below that level, the entire top-ten chart picture stays murky, and with the Federal Reserve chair change looming in May, the macro backdrop is not doing crypto any favors either.
Bitcoin Price Prediction: Bulls Struggling at Key Resistance
Bitcoin bounced off its 20-day exponential moving average at $75,478 on Wednesday, but the follow-through was weak. The long upper wick on the daily candle tells you everything: buyers pushed price higher, sellers pushed it right back down. That is not the behavior of a market getting ready to break out.
Woo posted on X that Bitcoin price prediction models are divided right now, some calling for a surge to $250,000 in 2026, others warning of a flush to $30,000 or below. His own read: 30% chance BTC clears $79,000 this time around. If it does break higher and takes out $80,000, the next target is $84,000. Fail that test, and the 50-day SMA at $72,086 comes back into the picture, with the longer-term support line as the last line of defense.
Trading account CRYPTOWZRD raised a historical pattern worth watching. According to a post on X, BTC has typically corrected for several months whenever a new Fed chair takes the helm. Kevin Warsh is set to replace the current chair in May, which puts that historical tendency squarely on the calendar.
Ether (ETH) is having a similar fight. Buyers are trying to hold price above the 20-day EMA at $2,291, but the bears are not backing off. A clean break below the moving averages reopens the path to the ascending channel support line. Hold that level and bounce, though, and ETH can work its way up toward $2,465 and eventually the channel upper resistance.
BTC has corrected for a few months after a new Federal Reserve chair takes over. With Kevin Warsh slated to take over as Fed chair in May, could BTC break the curse, or will it see a final dip?
What Is the XRP Price Outlook After the Moving Average Break?
XRP is the chart that caught the most attention on Tuesday. Price slipped below both moving averages, handing the bears a short-term advantage. The immediate question is whether the $1.27 support holds, because that is the level where buyers are expected to make a stand.
If $1.27 breaks, the XRP price prediction gets uglier fast. The February 6 low of $1.11 becomes the next target, and a close below that opens the door to $1.00 and then the lower support line. That is a long way down from current levels, and the pattern does not offer much cushion between those levels.
On the other side: if XRP bounces off $1.27 and reclaims the moving averages, the recovery can push all the way to the downtrend line. A close above that line would change the trend structure entirely. That is a binary setup and $1.27 is the hinge.
BNB, SOL, and DOGE: Three Range-Bound Charts With Different Stakes
BNB has been ranging between $570 and $687 for an extended stretch. The flat moving averages and RSI sitting just under the midpoint both suggest this consolidation is not done yet. Bulls get control above $687, which then projects to $730 and eventually $790. Bears take over below $570, which targets $500. Neither side has landed a decisive blow.
Solana is tighter still, coiled between $82.65 and $90.73. A break below $82.65 sends price toward the $76 support, a level the market is expected to defend hard because losing it opens a drop to $67. To the upside, Solana price prediction targets shift to $98 on a close above $90.73. Get past $98 and the next realistic objective is $117, a significant move if the broader market can find a catalyst.
Dogecoin (DOGE) bounced off its 20-day EMA at $0.10 on Monday, which is a modest positive. The bulls got DOGE above $0.11 Wednesday, but the daily wick shows sellers still lurking. Lose the EMA and DOGE probably ranges between $0.09 and $0.12 for a while longer. Hold $0.10 and the next test is the $0.12 resistance. Clear that and the short-term picture flips constructive.
HYPE, ADA, BCH, and XMR: Smaller Caps With Clear Setups
Hyperliquid (HYPE) turned away from overhead resistance at $43.76 on Monday and dropped to the 50-day SMA at $39.70 by Tuesday. Bears will try to push price below that SMA; success there opens a drop to $37.77 and then $34.45. The resistance zone between $43.76 and $45.77 is going to be a ceiling until buyers can break through it decisively. If they do, $50 and $51.43 are the upside objectives.
Cardano (ADA) is pressing against a downtrend line but the bulls have not surrendered ground either. That stubbornness is at least a small positive. Break the downtrend line and ADA targets $0.32 first, then $0.37, which would represent a legitimate trend reversal. Bears want to defend that line and drag price back to the $0.22 support; a close below $0.22 restarts the downtrend.
Bitcoin Cash (BCH) bounced off $443 on Tuesday but has not been able to clear the moving averages convincingly. Flat MAs and a mid-range RSI mean neither side has an edge right now. Hold above the MAs and BCH can test $486. Sellers will be there in force because a break above $486 projects to $520. Lose $443 and the next support is $419.
Monero (XMR) had the most dramatic recent move: a surge above the $390 resistance on Sunday, followed by a quick pullback to the 20-day EMA at $364. Buyers stepped in there, which is encouraging. If XMR can reclaim $406 on a closing basis, the next major target is $500. Stall here and the pair risks reverting to its established range of $302 to $390.
BTC needs to close above the $79,000 cost basis of recent investors to strengthen the recovery.
Key Levels to Watch Across the Top 10 This Week
Every coin in this analysis is at a decision point. BTC at the 20-day EMA, XRP at $1.27, SOL between $82.65 and $90.73, HYPE at the 50-day SMA. These are not soft zones. They are lines where price has actually reacted, which makes them meaningful to watch.
The macro risk that CRYPTOWZRD flagged is real. If BTC follows historical precedent and dips further after the Fed chair transition in May, support levels across altcoins get tested hard. Analysts who see $250,000 for BTC in 2026 may be right eventually, but the near-term chart says this recovery needs to clear $79,000 first, and the odds of that according to Woo are not even a coin flip.
Traders should track the specific support levels covered above rather than anchoring to year-end price targets. The charts right now are telling a more cautious story than the bullish macro narratives suggest.
Frequently Asked Questions
What is the Bitcoin price prediction for April 29, 2026?
Bitcoin rallied above $77,900 on April 29 but faced selling at higher levels. On-chain analyst Willy Woo gives 30% odds of BTC closing above $79,000. A successful break above $80,000 targets $84,000, while a breakdown below the 20-day EMA at $75,478 opens downside toward the 50-day SMA at $72,086.
What are the key support levels for XRP right now?
XRP’s immediate support is at $1.27. A hold there could trigger a recovery toward the downtrend line, while a break below $1.27 puts the February low of $1.11 at risk. Losing $1.11 opens the door to $1.00 and the lower structural support line on the XRP chart.
Is Solana in a bullish or bearish trend on April 29?
Solana is neutral, trading in a tight range between $82.65 and $90.73. A break below $82.65 targets $76 and potentially $67. A close above $90.73 shifts the outlook bullish with targets at $98 and $117. The flat range reflects a standoff between buyers and sellers.
What does the Monero (XMR) chart show after the $390 breakout?
XMR surged above $390 resistance on Sunday but pulled back to the 20-day EMA at $364, where buyers stepped in. If XMR closes above $406, the next major target is $500. A failure to hold the moving averages would push XMR back into the $302 to $390 consolidation range.
This article is for informational purposes only and does not constitute investment advice. Every investment and trading decision involves risk. Readers should conduct their own research before making any financial decisions.