











































What to Know
- Bitcoin gained 2.52% to trade above $78,800 after holding support at the 100-day EMA
- Spot cumulative volume delta hit 11,500 BTC, its highest level since February 17, showing buyers are in control
- Bitcoin futures open interest rose 6.64% to 257,000 BTC, pointing to fresh market positioning
- Bitcoin ETF inflows hit $1.97 billion in April 2026, with a nine-day consecutive inflow streak, the longest this year
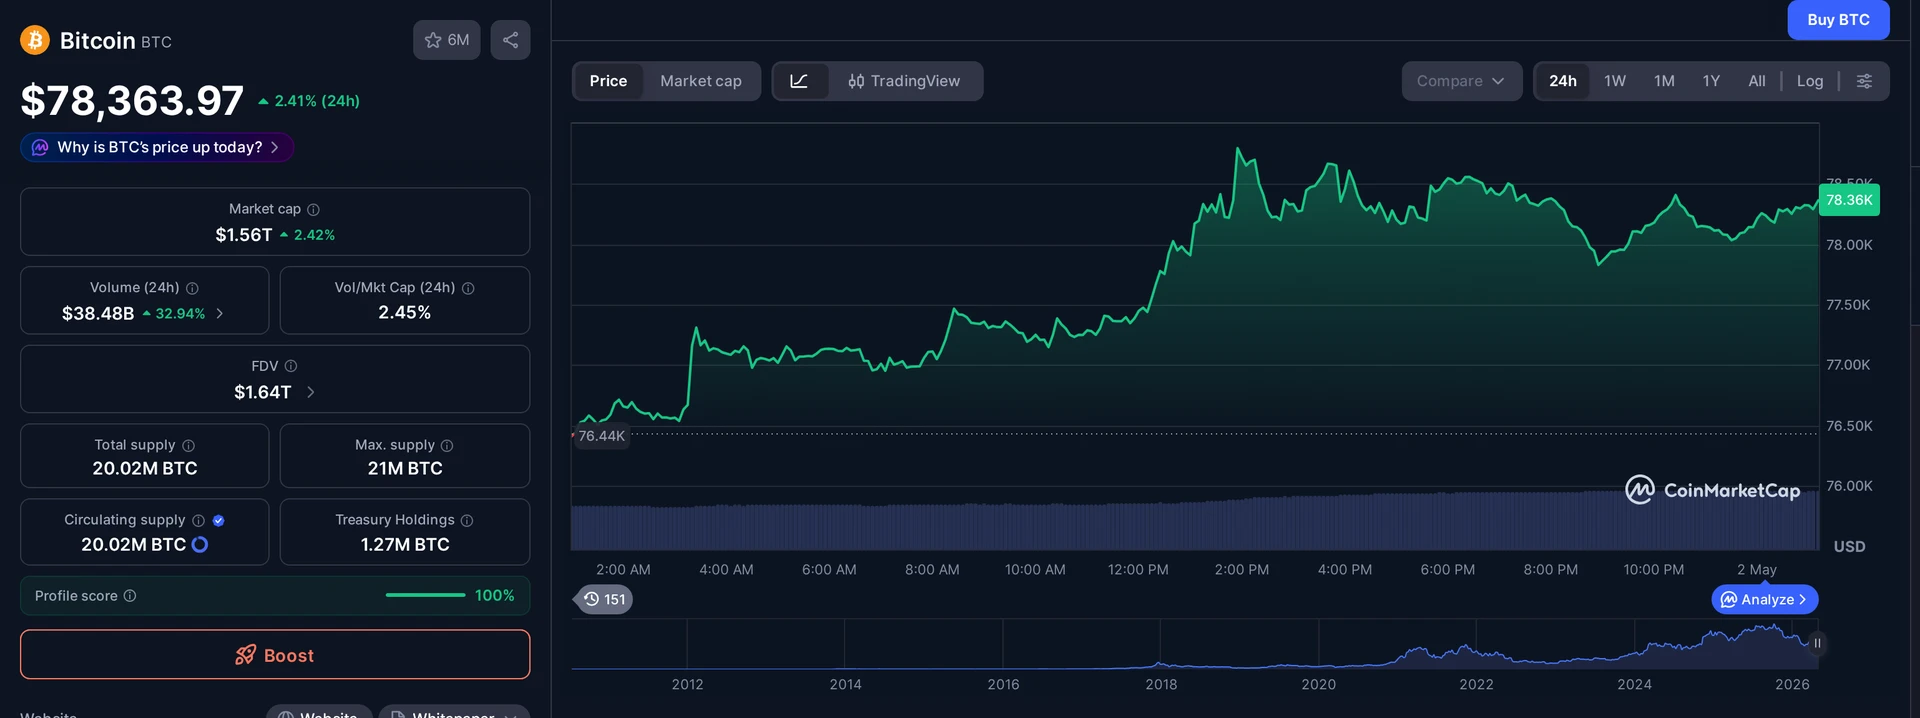
Three data signals now point to a Bitcoin rally to $80K, and they are coming from spot markets, derivatives, and institutional investors all at once. Spot buying demand is rising, futures markets are adding new positions, and institutional ETF money keeps flowing in. The price jumped 2.52% to $78,800 on Friday after holding the 100-day exponential moving average, a key technical level that has kept the medium-term trend bullish. Traders are watching $80,000 closely, and the numbers behind the move make a strong case that the breakout is not far away.
What Does the 100-Day EMA Bounce Mean for Bitcoin?
The 100-day exponential moving average has been acting as dynamic support on the daily chart, and Bitcoin defended it for two straight days before Friday’s push higher. That kind of repeated test followed by a hold tells you something real is underneath this market. Sellers tried twice. They failed twice.
The 2.52% gain that followed lifted BTC back to $78,800, putting $80,000 firmly within striking distance. On the daily timeframe, the trend structure has not broken. Higher lows are still in place, and the 100-day EMA, sitting well below the current price, is confirming that the longer-term chart remains bullish, according to on-chart analysis from TradingView data.
For anyone tracking Bitcoin through a trend-following lens, this bounce matters. It is the kind of confirmation that often precedes the next leg higher, especially when other data points line up alongside it, which, right now, they do.
Spot Buying Pressure Hit Its Highest Level Since February
One of the more convincing signals in this setup is the spot Bitcoin spot CVD 11500 BTC highest since February 2026 reading. The cumulative volume delta tracks net buying versus net selling in real time. When it rises, buyers are winning the tug-of-war. When it falls, sellers are.
Right now it is rising sharply. The spot CVD reached 11,500 BTC, its highest reading since February 17, according to data from Velo. That number matters because it is happening during a price consolidation below $80,000, not during a spike. Buyers are stepping in as supply appears, absorbing the dip rather than running from it.
That is the signature of a market in accumulation mode. Supply is being eaten. When that supply runs thin and demand keeps coming, prices move. The spot CVD is one of the cleaner reads on whether real money is behind a move, and right now it is pointing up.
Futures Open Interest Rose 6.64%, But Is This Fresh Positioning?
Fresh positioning in derivatives markets is one of the most reliable early signals of a coming price move. When open interest rises alongside price, it tells you that new participants are entering, not just existing holders reshuffling. That is exactly what the Bitcoin futures open interest 257000 BTC April 2026 data shows right now.
Aggregated futures open interest climbed 6.64% to 257,000 BTC in the past 24 hours, according to CoinGlass data. That follows a recent leverage flush of roughly 9,000 BTC, which cleaned out the overextended positioning that built up before. With that overhang cleared, the market is rebuilding from a healthier base.
The futures CVD, which tracks net directional pressure in derivatives, has also recovered to 98,300 BTC, signaling a return of net buying pressure. It is still below the levels seen during the April 27 correction, which means positioning is still building rather than overcrowded. That is actually a positive sign. Too much open interest too fast creates fragility. A measured rebuild suggests the move has room to grow.
Liquidity data from CoinGlass also shows that roughly $2.1 billion in short positions are clustered in the $78,000 to $80,000 range. If Bitcoin pushes through that zone, those shorts could be forced to cover, adding buying pressure on top of buying pressure. A short squeeze at $80,000 is a real possibility given the current setup.
The last time flows showed this kind of persistence was right before the October 2025 peak. Not saying we’re there yet, but it tells you the direction is improving.
Bitcoin Rally to $80K: What the ETF and OTC Data Show
The third data point comes from the institutional side of the market, and it reinforces the picture the on-chain and derivatives data are already painting. Bitcoin ETF inflows April 2026 nine-day streak reached $1.97 billion for the month, according to Ecoinometrics. More telling than the total is the consistency, a nine-day consecutive inflow streak, the longest run of the year in 2026.
Ecoinometrics noted that while the pace of individual daily inflows is moderate rather than explosive, the unbroken streak signals a shift in direction. The comparison to the period just before the October 2025 peak drew attention, though the newsletter was careful not to call a top repeat.
On the over-the-counter side, the 30-day change in OTC desk balances fell to around -20,700 BTC, levels last seen in March 2025, according to CryptoQuant. Lower OTC desk balances mean Bitcoin is moving off desks and into the hands of buyers, which tightens the immediately available supply. When institutions buy through OTC desks and those desks run low, spot market sellers have less inventory to work with.
Put all three data points together, the technical bounce, the spot CVD surge, the futures rebuild, and the ETF and OTC institutional flows, and you get a market that is quietly tightening. Not everywhere at once, but across spot, derivatives, and institutional channels simultaneously. That kind of broad alignment is rare. When it shows up, the $80,000 level tends to look less like resistance and more like the next stop on the chart.
Frequently Asked Questions
What three data points suggest Bitcoin will rally to $80K?
The three key data points are: Bitcoin’s spot cumulative volume delta reaching 11,500 BTC (highest since February 17), futures open interest rising 6.64% to 257,000 BTC signaling fresh positioning, and Bitcoin ETF inflows hitting $1.97 billion in April 2026 with a nine-day consecutive inflow streak.
What is Bitcoin's cumulative volume delta and why does it matter?
The cumulative volume delta (CVD) tracks net buying versus selling pressure in spot markets. A rising CVD means buyers are absorbing available supply. Bitcoin’s spot CVD reached 11,500 BTC in late April 2026, its highest since February 17, suggesting demand is outpacing selling during the current consolidation below $80,000.
How much money flowed into Bitcoin ETFs in April 2026?
Bitcoin ETF inflows reached $1.97 billion in April 2026, according to Ecoinometrics data. The month featured a nine-day consecutive inflow streak, the longest of 2026. Ecoinometrics noted this kind of persistent flow consistency was last seen before the October 2025 price peak.
What is the short squeeze risk near $80,000 for Bitcoin?
Approximately $2.1 billion in short positions are clustered in the $78,000 to $80,000 range, according to CoinGlass liquidation heatmap data. If Bitcoin breaks above that zone, forced short covering could add significant buying pressure and accelerate the move toward and beyond the $80,000 level.
This article is for informational purposes only and does not constitute investment advice. Every investment and trading decision involves risk. Readers should conduct their own research before making any financial decisions.


















CVD at 11,500 BTC is the one that actually matters here. OI can spike on shorts piling in just as easily as longs, so without delta context the 6.64% bump tells you very little on its own.
$1.97B in ETF inflows in a single window is wild if accurate. which issuer is doing the heavy lifting, IBIT again or is FBTC catching up?
been here since 2017 and every time three indicators line up perfectly someone forgets about the macro tape. PCE print next week could nuke this thesis in a single candle.
spot CVD finally turning positive feels overdue tbh
80k by end of May feels aggressive but not impossible if ETF flows hold above $1B weekly. the 6.64% OI uptick paired with positive spot CVD is the cleanest setup we’ve had since the Q1 chop, just watch funding because if it flips to 0.05%+ you know retail showed up late again.