


What to Know
- $4.37 billion drained from U.S. spot crypto ETFs over 13 consecutive daily outflow sessions since mid-May 2026
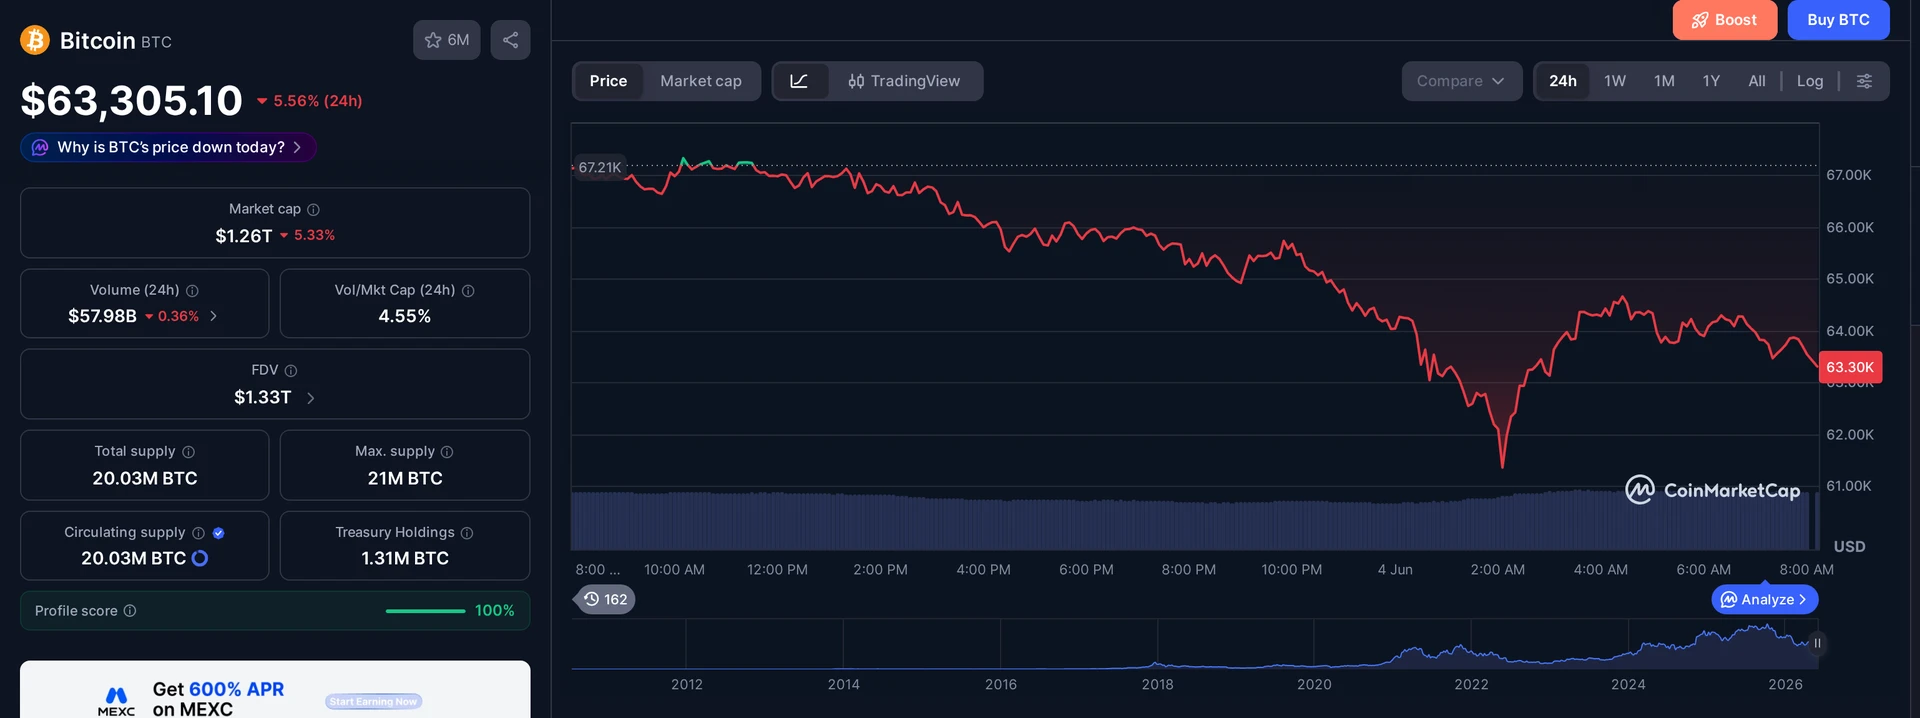
- BlackRock’s IBIT led Wednesday’s losses with $342.34 million in redemptions as bitcoin traded around $65,462
- 21Shares’ THYP was the only major crypto fund in positive territory, pulling in $2.99 million on the day
- Citi says ETF flows explain roughly 45% of weekly BTC price moves and expects sentiment to stay negative while outflows continue
Bitcoin ETF outflows have now dragged every major crypto fund category into the red. U.S. spot bitcoin ETFs extended a record-breaking losing streak to 13 straight sessions on Wednesday, June 4, shedding another $396.60 million and pushing the total drain to $4.37 billion since mid-May. Ether, solana, and XRP funds all joined the selloff on the same day. The one exception was Hyperliquid’s spot HYPE ETF, which kept attracting fresh capital while everything else bled.
BlackRock IBIT Leads Bitcoin ETF Outflows for 13 Sessions
BlackRock’s IBIT took the biggest hit on Wednesday, absorbing $342.34 million in redemptions and accounting for the bulk of the day’s total outflow. According to BlackRock IBIT bitcoin ETF outflows 13 sessions tracked by SoSoValue, the fund dropped 2.76% as bitcoin traded around $65,462, a steep fall from the levels above $71,000 seen at the start of the week. Fidelity’s FBTC added another $54.26 million to the outflow total, declining 2.65% on the same session.
The numbers tell a punishing story at the portfolio level. Total net assets across all U.S. spot bitcoin ETFs stood at $104.29 billion on May 15, the final session before the outflow streak kicked off. By Wednesday they had dropped to $82.83 billion, a $21.46 billion decline in roughly three weeks. That damage comes from two directions: actual redemptions pulling money out of the funds, and bitcoin’s own price slide reducing the value of every share still outstanding.
Bitcoin ETF assets under management now represent 6.36% of bitcoin’s circulating market cap, down from above 7% at the May peak. That shrinkage matters because it signals that institutional conviction, which powered the original ETF launch rally, is not holding at current price levels. When the biggest fund in the space, IBIT, is hemorrhaging over $340 million in a single day, it is hard to argue the dip-buyers are anywhere near ready to step in.
ETH SOL XRP ETFs All Join the Outflow Wave
The bleeding was not limited to bitcoin funds. Ether ETFs lost a combined $52.94 million on Wednesday, with BlackRock’s ETHA responsible for nearly all of it at $51.58 million. The fund dropped 5.56% as ether slipped below $1,900, a level that represents a meaningful psychological floor for ETH bulls and one that has now been broken.
Solana funds shed $12.74 million on the same day. Bitwise’s BSOL led the solana category with $11.56 million in outflows. XRP products weren’t spared either, losing $5.34 million in total, with Bitwise’s flagship XRP ETF absorbing the full weight of those redemptions.
The broader shift here is worth pausing on. For several weeks earlier this spring, altcoin ETFs, solana, XRP, and ether products in particular, had managed to attract modest but steady retail inflows even as bitcoin funds faced mounting pressure. That divergence gave some analysts reason to argue that investor appetite was rotating rather than retreating. Wednesday ended that narrative. All four major categories reported net daily outflows simultaneously, and the multi-session streak now spans every major product on the market. The rotation thesis has run out of road.
Why Is the HYPE ETF the Only Fund in the Green?
Hyperliquid’s spot ETF complex kept drawing inflows even as the rest of the market sold off
Hyperliquid’s HYPE token posted a 3.45% gain on Wednesday, reaching $73.39, while every other major crypto asset moved lower. That price action translated directly into fund flows. 21Shares’ THYP pulled in another $2.99 million on the day, according to the 21Shares THYP Hyperliquid spot ETF inflows announcement from the May 12 launch.
Since that launch date, cumulative HYPE ETF net inflows have reached $139.51 million, with total net assets now sitting at $192.01 million. Those are not massive numbers by the standards of IBIT or even ETHA, but they represent consistent positive flow during a period when every other fund category is in outflow. That consistency is the story.
The competitive landscape around Hyperliquid ETFs got more crowded on Wednesday. Grayscale launched its own product, HYPG, pitching it as the lowest-fee U.S. spot HYPE vehicle available and explicitly undercutting Bitwise’s BHYP and 21Shares’ THYP on expense ratio. The timing is notable, Grayscale chose the same day that every other major crypto ETF was posting outflows to enter the HYPE space, essentially betting that the token’s relative strength will continue drawing fee-sensitive investors even as the broader market retreats. Call that confidence or opportunism, but Grayscale clearly sees something worth competing for.
Spot bitcoin ETF flows explain roughly 45% of weekly BTC price moves. They are the best gauge of investor adoption we have right now.
What Does a 13-Session Outflow Streak Mean for BTC Price?
Citi told clients on Tuesday that spot bitcoin ETF flows account for roughly 45% of weekly BTC price moves, the strongest correlation of any single data series the bank tracks, according to Citi bitcoin ETF flows BTC price 45 percent reported by FinanceFeeds. That means the 13-session outflow streak is not just a product-level story. It is a price-level story. If ETF redemptions are driving nearly half of BTC’s weekly price action, then a streak of this length and magnitude carries real downside risk.
Citi’s analysts also flagged the stalled U.S. crypto market structure bill as a secondary headwind. The regulatory uncertainty was supposed to be resolving this year, and for a while in early 2026, it looked like it might. But as long as the bill sits in legislative limbo and ETF flows remain negative, the bank expects investor sentiment to stay subdued. That is a polite way of saying the conditions for a relief rally do not yet exist.
The math is straightforward and uncomfortable. Bitcoin fell from above $71,000 to around $65,462 in a matter of days. Total bitcoin ETF assets under management dropped by $21.46 billion in three weeks. AUM as a share of bitcoin’s market cap compressed from above 7% to 6.36%. These are not minor fluctuations, they represent a genuine unwinding of the positioning that drove the spring rally. Whether the next catalyst is the market structure bill, a macro shift, or something else entirely, the current data makes it hard to argue that the bottom is in.
The UMA protocol also weighed in this week on a related dispute: UMA voters ruled that Strategy’s June 1 disclosure qualified for the June contract, even though the company acknowledged it sold bitcoin during the final week of May. That ruling touches on market integrity questions that have been simmering beneath the surface of institutional bitcoin adoption all year.
Frequently Asked Questions
How many consecutive days have bitcoin ETFs seen outflows as of June 4, 2026?
U.S. spot bitcoin ETFs recorded net outflows for 13 consecutive trading sessions as of Wednesday, June 4, 2026. The streak began after May 15 and has drained a total of $4.37 billion from the funds, with BlackRock’s IBIT leading daily redemptions throughout the streak, per SoSoValue data.
Which crypto ETF is still seeing inflows while the rest bleed?
Hyperliquid’s spot HYPE ETFs were the only major crypto fund category still attracting net new money. 21Shares’ THYP pulled in $2.99 million on June 4, bringing cumulative inflows to $139.51 million since the May 12 launch. HYPE token itself gained 3.45% on the same day the rest of the market sold off.
How much have BlackRock IBIT outflows totaled during the streak?
BlackRock’s IBIT has led daily outflows throughout the 13-session streak. On June 4 alone it saw $342.34 million in redemptions, which was the bulk of that day’s $396.60 million total. Overall U.S. spot bitcoin ETF assets dropped from $104.29 billion on May 15 to $82.83 billion by June 4, a $21.46 billion decline.
What is Citi saying about bitcoin ETF flows and BTC price?
Citi told clients on June 3 that spot bitcoin ETF flows explain roughly 45% of weekly BTC price moves, making them the most reliable gauge of investor adoption available. The bank expects sentiment to remain subdued as long as ETF flows stay negative and the U.S. crypto market structure bill remains stalled in Congress.
This article is for informational purposes only and does not constitute investment advice. Every investment and trading decision involves risk. Readers should conduct their own research before making any financial decisions.


13 straight sessions of outflows is wild. The $4.37B figure lines up with what Farside was showing yesterday, but I’m curious how much of that is IBIT specifically versus the smaller funds bleeding harder on a percentage basis.
calling HYPE staying positive a real signal feels like a stretch when the AUM is a rounding error next to IBIT
Saw this coming the moment SOL ETF flows turned red last week. Nobody wants to catch a falling knife into June.
Anyone else notice XRP funds bleeding harder than ETH on a relative basis? Wondering if that’s profit taking from the spot rally or actual capitulation from the late buyers.
Reminds me of the GBTC unwind in early 2024, except this time spot ETFs are the ones puking. 13 sessions is nothing yet, the 2022 drawdown ran almost a full quarter before anyone called a bottom.
hype token holding green while everything else dumps is suspicious tbh