


What to Know
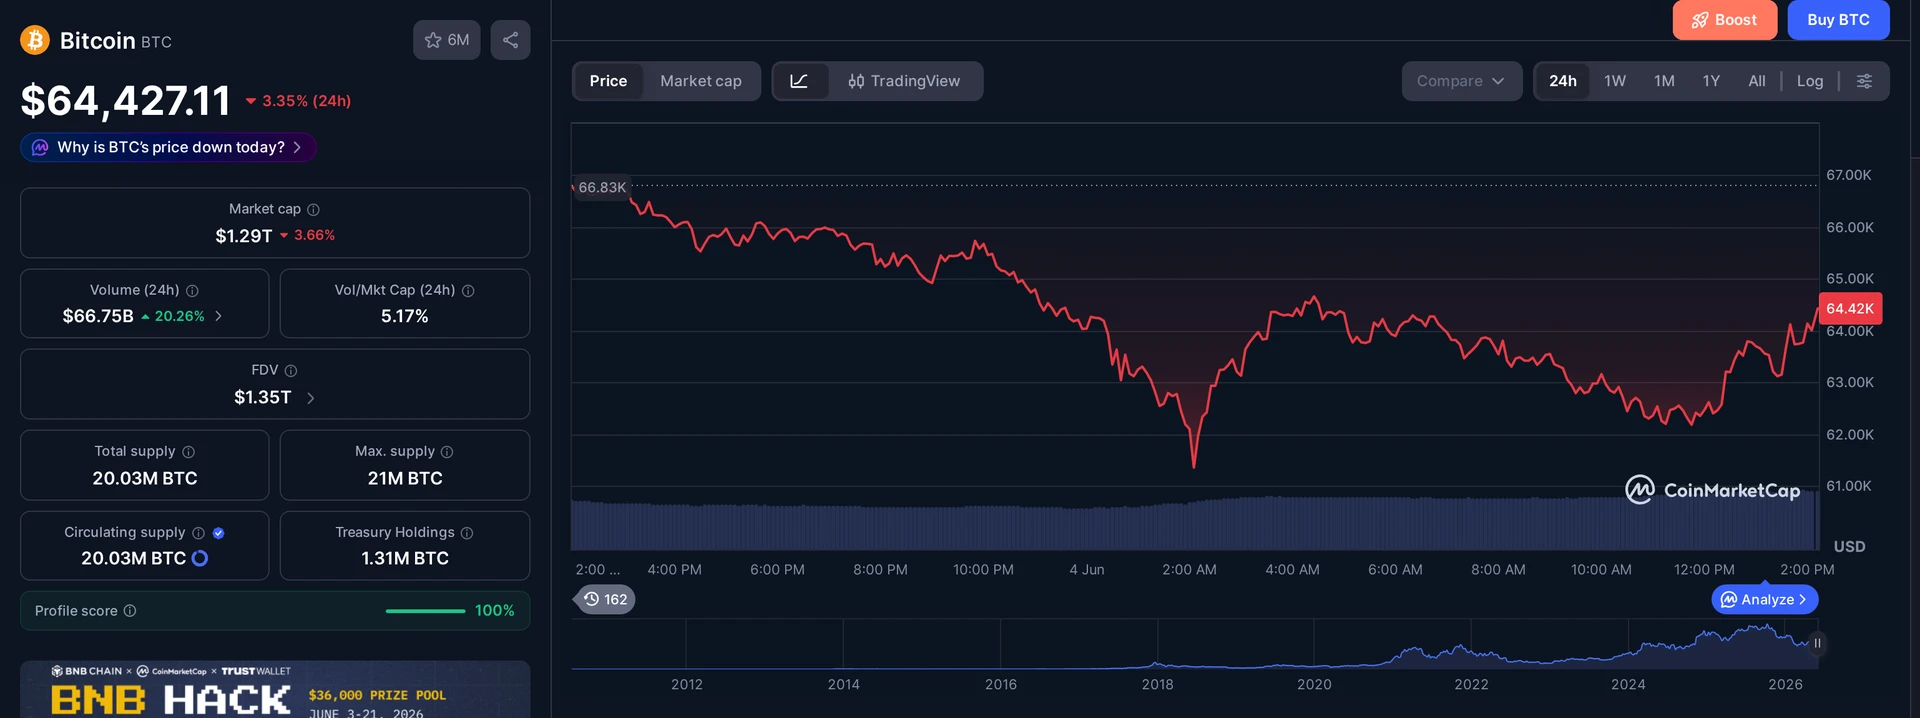
- $61,000, Bitcoin dropped to that level on June 4, 2026, down from above $82,000 just weeks earlier
- 13 consecutive days of spot Bitcoin ETF net outflows totalled over $4 billion since May 14
- 54,000 BTC worth $3.35 billion moved to exchanges in one week, spiking short-term selling pressure
- CryptoQuant CEO notes 53% of Bitcoin realized cap is now held by the 6-month to 2-year cohort, up from 15% in 2024
The Bitcoin crash of June 2026 is now 13 days deep in spot ETF outflows, and the damage to BTC’s price is hard to ignore. Bitcoin fell to around $61,000 on June 4, 2026, a brutal 25% drop in less than a month after trading above $82,000. Six distinct forces drove this collapse, and understanding each one matters if you’re watching your portfolio bleed in real time.
What Caused the Bitcoin Crash in June 2026?
The single loudest signal in this crash is the relentless tide of money leaving spot Bitcoin ETFs in the US. According to data from SoSoValue, funds have posted net outflows for 13 straight days. Several of those sessions saw withdrawals above $500 million, $600 million, and even $700 million in a single day.
The current week is already on pace to set a new record. By Wednesday, spot Bitcoin ETF outflows 13 consecutive days had already reached $1.4 billion, making this one of the three largest weekly exodus events the products have ever seen. That’s a sharp reversal from mid-May, when investors were rushing to pile money in.
The ETF channel matters because it is the most direct link between traditional finance and Bitcoin’s spot price. When institutional allocators pull billions out over two straight weeks, there is no natural buyer on the other side at current prices. The market has to find a new floor.
54,000 BTC Hit Exchanges in One Week
It was not just ETF holders selling. On-chain analyst Ali Martinez tracked a sharp spike in Bitcoin being transferred directly to trading platforms. Roughly 54,000 BTC, valued at around $3.35 billion at the time, moved onto exchanges in a single week. When that transfer cycle started, the same coins were worth nearly $3.8 billion.
Large inflows to exchanges are a well-known leading indicator of selling pressure. Holders do not park coins on exchanges to admire them. They park them to sell. That wave of supply hit the order books and dragged the price down to roughly $65,300 before further losses followed.
The sheer size of this transfer, nearly $3.8 billion worth of Bitcoin queued up for potential sale, is not noise. It is a coordinated unwinding by a category of holders who decided the risk-reward no longer made sense at these levels.
Strategy Sold, and Mt. Gox Added to the Fear
Two additional sellers entered the picture and rattled already nervous markets. First, Strategy confirmed it had sold a portion of its Bitcoin holdings. The amount was small relative to the company’s massive overall BTC position, but the symbolism was damaging. Strategy has been one of the loudest corporate advocates for holding Bitcoin at any price. Any sale, however minor, reads as a crack in conviction to investors who were already looking for reasons to exit.
Then came Mt. Gox 10422 BTC transfer June 2026. On-chain data showed Mt. Gox-linked wallets moving 10,422 BTC, roughly $739 million, to exchange-connected addresses. The defunct exchange has been a source of recurring fear ever since repayments to creditors began. Each time those wallets move, the market braces for a flood of coins hitting the open market.
Neither event by itself would have caused a crash of this magnitude. Together, in a market already suffering from ETF outflows and exchange inflows, they poured accelerant on a fire that was already burning.
US-Iran War Escalation Hit Risk Assets Hard
Macro risk is the fourth reason. After weeks of ceasefire and failed permanent peace talks, the US and Iran resumed direct attacks on June 4, 2026. The conflict has since expanded to include Kuwait and other regional nations. That kind of geopolitical escalation sends money out of risk-on assets, and Bitcoin, whatever its long-term narrative as a safe haven, trades as a risk asset when fear spikes.
This is not a new pattern. When the initial US-Iran strikes began in late February, Bitcoin dropped by several thousand dollars within hours. The market has a recent memory of that reaction, and traders who watched that episode were quick to reduce exposure when fighting resumed.
War escalation does not need to last long to do lasting price damage. The uncertainty it creates is enough to freeze institutional buying and accelerate selling from anyone who was already uncomfortable with their position size.
Is This Capital Rotation From Bitcoin to AI?
The fifth reason, and the most debated, comes from Michael Saylor himself. The Strategy chairman posted on June 4, 2026 that capital markets have been funding the AI infrastructure buildout at an extraordinary rate, roughly $400 billion over six months. His argument is that the same investors who drove Bitcoin ETF inflows during the bull run are now redirecting capital toward AI hardware, data centers, and the companies building that stack.
Michael Saylor AI capital rotation 400 billion Bitcoin framing is notable because Saylor is not bearish about it. He calls it rotation, not impairment, and says volatility creates opportunity. That is a measured take from someone with enormous personal exposure to BTC’s price.
Whether you buy the rotation thesis or not, the timing correlation is hard to dismiss. Bitcoin ETF outflows of roughly $4 billion since May 14 line up closely with the most recent surge in AI investment headlines and earnings beats from the major hyperscalers.
Capital markets are funding the AI buildout at historic scale: ~$400B over 6 months. Bitcoin ETFs have seen ~$4B of outflows since May 14, pressuring $BTC. This is a capital rotation, not a Bitcoin impairment. Volatility creates opportunity.
What Happens Next? Analysts Are Split on Price Targets
The sixth reason for the crash is psychological, and it feeds back into the price. When big holders sell, small traders follow. When ETF outflows hit record pace, retail sentiment turns negative. That feedback loop accelerates declines past what fundamentals alone would justify.
On the bearish side, analyst Ali Martinez is watching the MVRV pricing bands closely. Based on that model, he has flagged $55,000 and potentially $50,000 as the next logical support zones. Bitcoin has not traded at those levels in nearly two years. A drop there would feel devastating to anyone who bought during the 2025 bull run.
CryptoQuant CEO Ki Young Ju sees the picture differently. Yes, price is near two-year lows, but the holder composition is completely different now. The 6-month to 2-year cohort holds 53% of Bitcoin’s realized cap today, up from just 15% in 2024. These are not panic sellers. In the last cycle, Bitcoin bottomed when that cohort’s share hit 68%. By that measure, the market may still have room to fall, but it is building a foundation of patient holders that did not exist at prior bottoms.
The split between those two views is real and it matters. Either Bitcoin is heading to $50,000 as the MVRV bands suggest, or it is building the same kind of long-term holder base that preceded the next leg up. Both can be partly true at the same time.
Bitcoin is at the same price as two years ago, but one thing is different. The 6m-2y cohort, who joined this cycle, now holds 53% of realized cap, up from 15% two years ago. Last cycle, Bitcoin bottomed when this hit 68%. Short-term holders are evolving into long-term holders.
Frequently Asked Questions
Why did Bitcoin crash in June 2026?
Bitcoin dropped roughly 25% from above $82,000 to around $61,000 due to six factors: 13 consecutive days of spot Bitcoin ETF outflows, 54,000 BTC moved to exchanges, Strategy selling part of its holdings, Mt. Gox wallet activity, US-Iran war escalation, and capital rotating toward AI investments.
What are spot Bitcoin ETF outflows and why do they matter?
Spot Bitcoin ETF outflows occur when institutional investors redeem shares and the fund sells Bitcoin to cover them. Sustained outflows remove direct buy pressure from the market. When 13 straight days of outflows total over $4 billion, as happened in late May and early June 2026, it creates significant downward price pressure.
Could Bitcoin fall to $50,000?
Analyst Ali Martinez flagged $55,000 and $50,000 as possible support zones based on MVRV pricing bands. However, CryptoQuant CEO Ki Young Ju argues that the current holder base is far stronger than at prior lows, with long-term holders now controlling 53% of realized cap versus 15% in 2024.
What is Michael Saylor's explanation for the Bitcoin price drop?
Saylor attributed the drop to capital rotation from Bitcoin into AI infrastructure. He noted that capital markets have funded the AI buildout at roughly $400 billion over six months, causing about $4 billion in Bitcoin ETF outflows since May 14. He framed this as rotation rather than a structural problem with Bitcoin.
This article is for informational purposes only and does not constitute investment advice. Every investment and trading decision involves risk. Readers should conduct their own research before making any financial decisions.


$1.4B outflows in a single week is brutal, but what stood out to me was how fast the funding rates flipped negative. Anyone got the exact basis spread number when it bottomed at 61k?
called it back in May when ETF inflows started softening, nobody wanted to hear it
25% drawdown is honestly tame compared to 2018 or even March 2020. people calling this a crash never sat through an 84% bleed waiting two years just to break even