











































What to Know
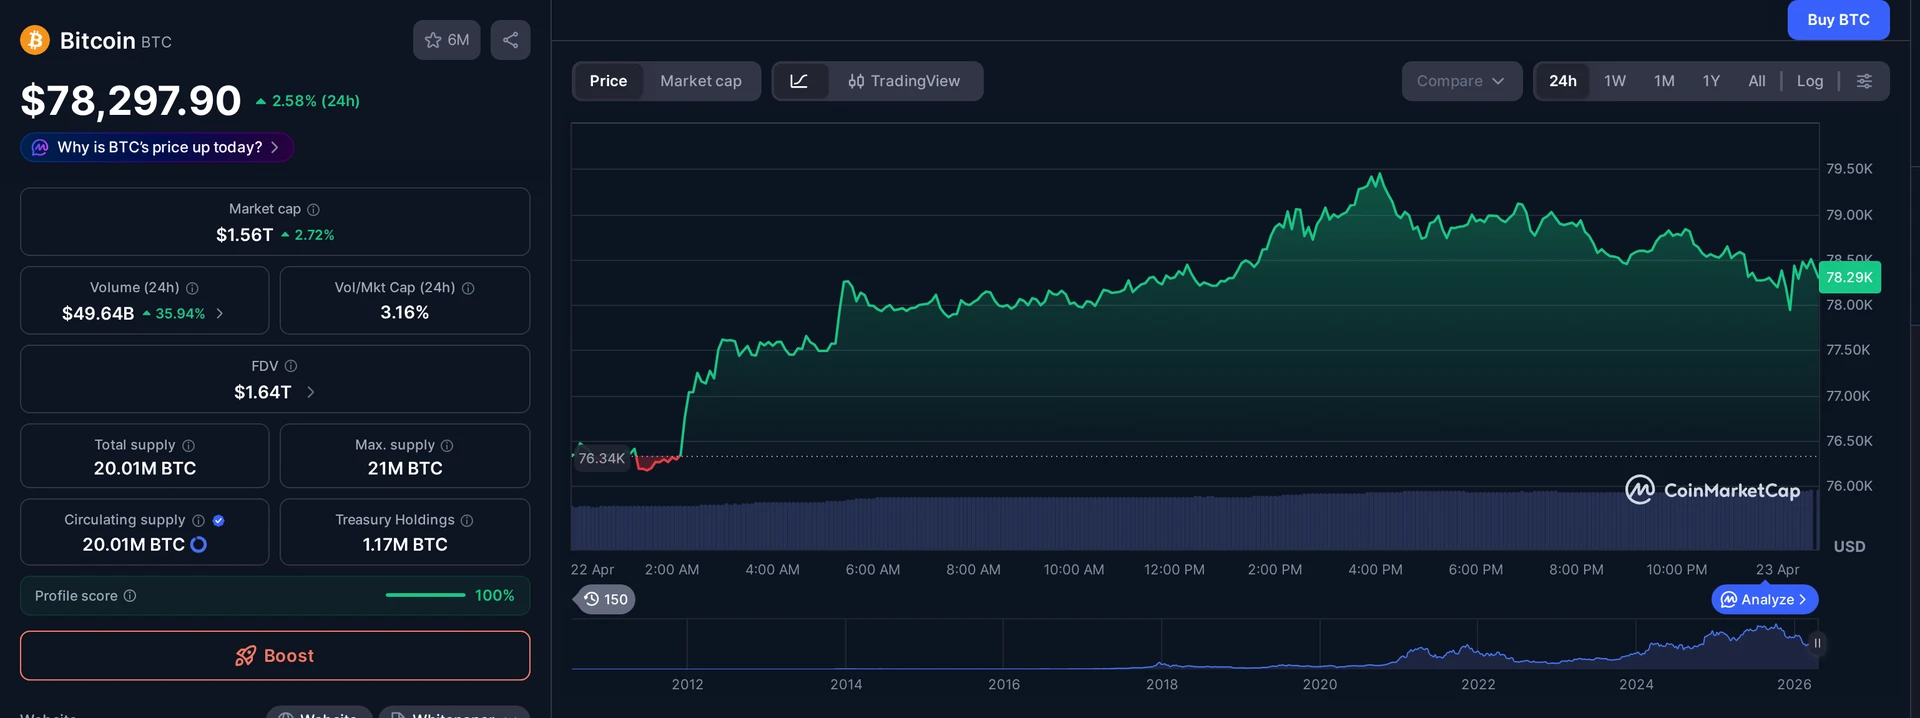
- Bitcoin printed a monthly high of $79,472 on Wednesday, its strongest 28-day return since April 2025.
- The Bitcoin positioning index flipped to 4.5 from -10.9 in February, confirming derivatives traders have swung net-long.
- Aggregated open interest jumped 6.7% in 24 hours to 260,000 BTC, with the 30-day change now at +14.5%.
- The $88,000 to $91,000 band is the next real fight, anchored by the three-to-six-month holder cost basis at $91,600.
The Bitcoin positioning index just snapped back to life, and the futures desk is doing most of the talking. BTC tagged a monthly high of $79,472 on Wednesday, April 23, booking its strongest 28-day return in a year as use rushed back in and the derivatives book turned decisively net-long. This is not the kind of grind higher you get from spot bids alone. It has the fingerprints of a positioning reset, and the tape has been closing green in 23 of the last 30 sessions.
Why Is the Bitcoin Positioning Index Flashing Bullish Again?
Short answer: because almost every derivatives input flipped at the same time. The Bitcoin positioning index four-month high reading pushed its 30-day average to 4.5, up from -10.9 back in February. That is not a drift. That is a regime change in how traders are laddering into the futures market.
The index is a composite. It blends net taker flow direction, open interest trends, funding rates and exchange balances into a single number. When all four inputs line up on the same side of the ledger, the reading starts to matter more than any one of them in isolation. Right now they are all pointing the same way, and they have been doing so since late March.
Researcher Axel Adler Jr. tracked the climb from a reading of 0.4 in late March to today’s 4.5. The shape of that move matters. It is not a spike. It is a slope. Slow readings of this index that keep grinding higher without breaking the underlying price trend are the kind of setup that usually precedes sustained rallies rather than failed breakouts.
The positioning index has turned higher, with its 30-day average rising to 4.5 from -10.9 in February.
Open Interest Confirms the Capital Shift
Here is the part that separates a real positioning build from noise. Aggregated open interest jumped 6.7% in the last 24 hours to 260,000 BTC, and the 30-day change now sits at +14.5%. New money is actually showing up to the desk, not just recycled longs rotating from one exchange to another.
Open interest expanding while price grinds higher is the textbook signature of fresh participation. If traders were simply flipping existing shorts to longs, open interest would stay flat while funding moved. What is happening instead is both legs tightening at once: more contracts outstanding, more capital at risk, more conviction in the move.
A small caveat worth noting. Leverage actually dropped 10.7% over the weekend before this week’s rebuild, which flushed out weaker hands before the push higher. That is healthier than the alternative. Rallies that start from a clean leverage reset tend to last longer than rallies that start from already-stretched positioning. The BTC price chart has the right shape, even if the volatility sets up a lot of pain trades on the way.
- 30-day open interest change: +14.5%
- 24-hour open interest change: +6.7%, now at 260,000 BTC
- Weekend use drop: 10.7%, cleared weak longs before the rebuild
- Sessions closed green in last 30: 23 of 30
The $88,000 Supply Zone Is the Real Fight
BTC has pushed above the descending trendline that has capped every rally since the October 2025 peak near $126,000, and it has reclaimed the 100-day exponential moving average. On the higher time frame this is a trend shift, from outright bearish to neutral-to-bullish. The shape is right. The volume is right. Now the price has to do the hard part.
The first real test sits at $81,000, where a small fair-value gap creates a liquidity imbalance. If buyers hold that level on a retest, it confirms acceptance of higher prices rather than rejection. Above that, the story gets more interesting and more dangerous. The $88,000 to $91,000 range is the supply zone shaped by the prior distribution phase, when large volumes of BTC last changed hands before the drawdown.
This is where the Bitcoin short-term holder cost basis becomes a weapon rather than a data point. The realized price of the three-to-six-month holder cohort sits at $91,600. Most of those wallets are now hovering near break-even or in slight profit. When price revisits that zone, activity spikes. Some sell into green for the first time in months. Some hold for bigger moves. Whichever side wins decides the next leg.
A sustained close above $91,000 would signal that buyers are absorbing overhead supply rather than being repelled by it. A rejection sends price back into the mid-$80,000s to rebuild. There is no middle outcome at that level, and every trader with size knows it.
The $88,000 to $91,000 range stands out as a key supply zone, shaped by a prior distribution phase when large volumes of Bitcoin last changed hands.
Where Does Support Actually Hold if Bitcoin Drops?
Support: the $72,000 to $75,000 band, underpinned by clusters of realized prices from mid-term holders. That is the floor that matters. Break below it and a meaningful slice of supply flips into unrealized loss, which historically increases the probability of reactive selling rather than patient holding.
Analyst Crazzyblockk has called out the tight range BTC is currently trapped in. The $83,000 to $85,000 zone above is the profit-taking band for recent short-term holders who bought the October drawdown. Price strength through that range would signal that buyers are willing to eat the supply those holders are offering. Price weakness there signals the opposite, that recent bids were not deep enough to absorb even modest profit-taking.
- Floor: $72,000 to $75,000, mid-term holder realized price cluster
- First resistance: $81,000, fair-value gap and liquidity imbalance
- Profit-taking band: $83,000 to $85,000, short-term holder cost zone
- Major supply zone: $88,000 to $91,000, prior distribution phase
- Decision point: $91,600, three-to-six-month holder realized price
The Cynical Read: Leverage Is a Double-Edged Sword
Call it conviction, call it complacency: when open interest rips 14.5% in a month while price pushes into a supply zone, somebody is going to get liquidated. That is not a prediction. That is arithmetic. The question is which side.
If the move through $81,000 holds and buyers carry into the $88,000 zone, every short that layered in between $75,000 and $80,000 is underwater, and their liquidations become fuel. If the rejection comes, the freshly opened longs, the ones responsible for the 6.7% overnight OI surge, are the ones holding the bag. Leveraged markets rarely offer a clean exit for both sides.
The positioning data tells you where the crowd is. It does not tell you whether the crowd is right. The Bitcoin positioning index hit similar readings in late 2024 before a sharp drawdown, and it also hit them before the run to $126,000. The signal is the setup, not the outcome. Anyone framing 4.5 as a guarantee rather than a condition is selling something.
What is undeniable is that the market has shifted from defensive to offensive positioning in roughly eight weeks. The February reading of -10.9 was a market that did not want to be long BTC. The April reading of 4.5 is a market that does. Whether that stays true through the $88,000 fight is the only question that matters for the rest of the quarter.
What Traders Should Watch Next
Three things decide the next two weeks. First, whether $81,000 holds on the inevitable retest. A clean hold with rising volume flips that fair-value gap into confirmed support. Second, whether aggregated open interest keeps climbing or stalls. Continued expansion with price validates the thesis. A stall while price pushes higher is a warning flag that new buyers are running out.
Third, and most telling, what the three-to-six-month holder cohort does if BTC tags $91,600. If those wallets hold instead of distributing, the supply zone cracks and the path to revisiting the $126,000 peak opens up fast. If they sell, the rally has a ceiling and the market gets another range-bound summer.
Frequently Asked Questions
What is the Bitcoin positioning index?
The Bitcoin positioning index is a composite metric that combines net taker flow direction, open interest trends, funding rates and exchange balances into one number. Researcher Axel Adler Jr. uses it to gauge whether the derivatives market is leaning net-long or net-short. Its 30-day average reading currently sits at 4.5.
Why did Bitcoin hit $79,472 on April 23?
Bitcoin reached $79,472 because derivatives traders rebuilt long positioning after a weekend use flush. Aggregated open interest jumped 6.7% in 24 hours to 260,000 BTC, while the positioning index climbed to a four-month high of 4.5, confirming fresh capital moved into futures alongside spot demand.
What is the next major resistance level for BTC?
The $88,000 to $91,000 range is the next major resistance zone for Bitcoin, shaped by a prior distribution phase when large volumes last changed hands. The realized price of the three-to-six-month holder cohort sits at $91,600, making this band a critical decision point for the rally.
Where does Bitcoin support hold if the rally fails?
Key support for Bitcoin sits in the $72,000 to $75,000 band, supported by clusters of realized prices from mid-term holders. A break below this floor would push significant supply into unrealized loss, raising the risk of reactive selling and a deeper correction back toward earlier lows.
This article is for informational purposes only and does not constitute investment advice. Every investment and trading decision involves risk. Readers should conduct their own research before making any financial decisions.


















positioning index at 4.5 is high but not euphoric, the 2021 peaks pushed past 6 before things actually topped. 14.5% OI jump in 30 days is more interesting to me, that’s leverage building into a resistance zone near 80k and funding rates will tell the real story next week
anyone know if that 4.5 reading weights perps and CME futures equally or is it skewed toward offshore venues? makes a big difference in how you read the crowding
bears got flushed again
Touched 79,472 and still no clean break of 80k, I’ll believe the melt-up when we hold a daily close above it with spot volume confirming. Otherwise this is just OI froth.