











































What to Know
- $635 million left U.S. spot bitcoin ETFs on May 13, the highest single-day outflow since January 29
- Five straight days of redemptions have drained $1.26 billion total from the 11 listed funds
- Cumulative net inflows since the January 2024 ETF launch dropped from $59.76 billion to $58.5 billion
- Bitcoin fell over 2% to $79,400, stalling near the 200-day moving average just above $82,000
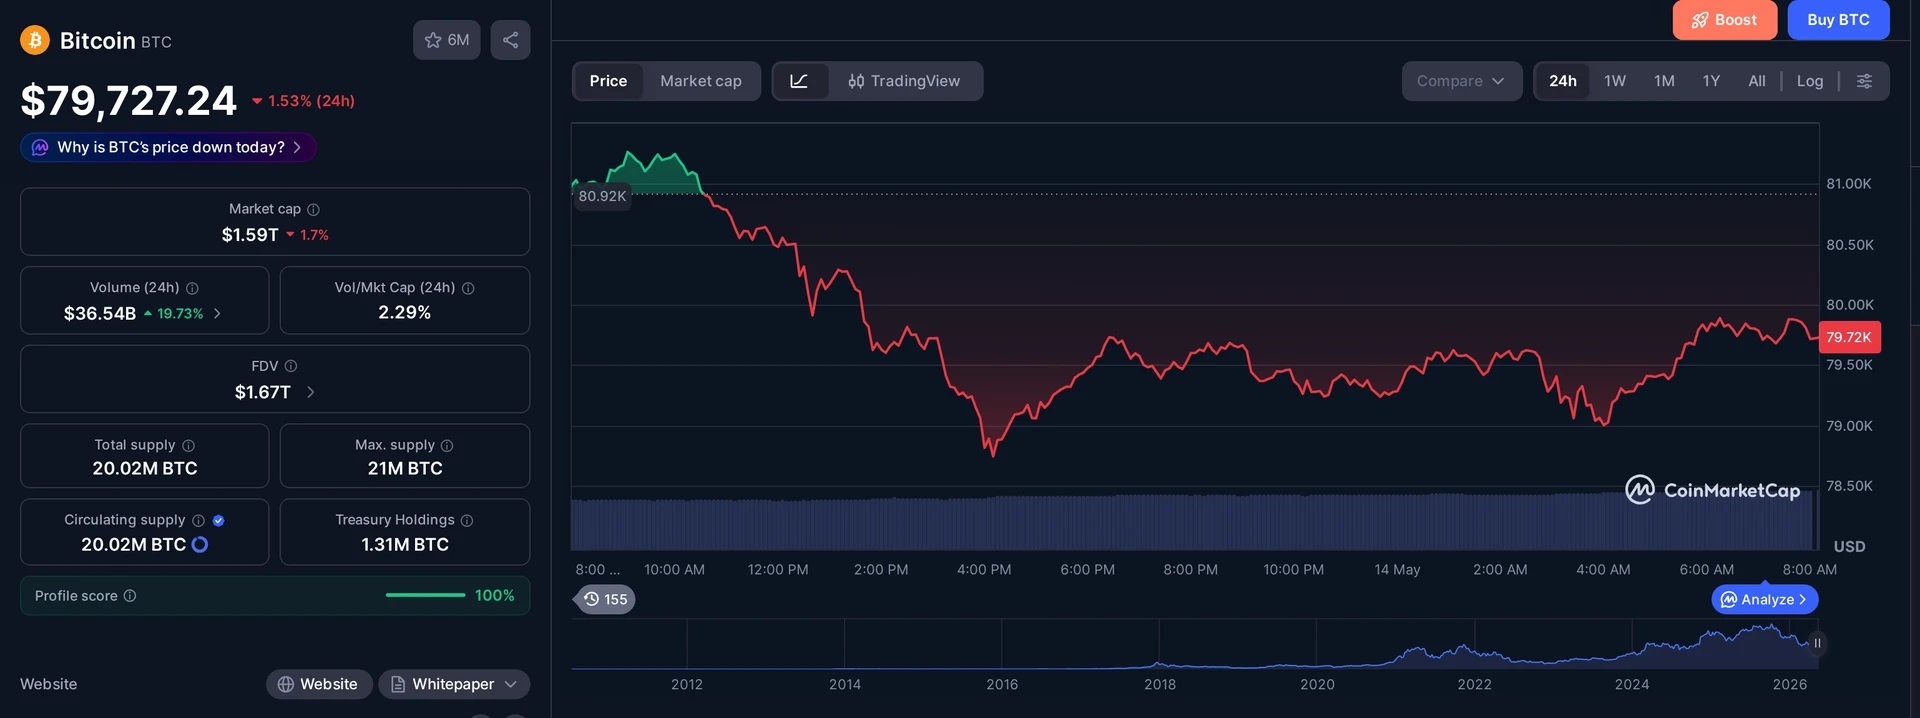
Bitcoin spot ETF outflows just posted their worst single day since late January, and the timing could not be worse for bulls. On May 13, investors pulled $635 million out of the 11 U.S.-listed spot bitcoin funds in one session, a record redemption day for 2026, as bitcoin itself fell over 2% to $79,400 and a key technical ceiling held firm near $82,000. The tailwind that supposedly carried bitcoin above $80,000 through March and April is now blowing in reverse.
What Drove the $635 Million Bitcoin Spot ETF Outflow?
The $635 million exit on May 13 was the largest net outflow from U.S. spot bitcoin ETFs since January 29, according to SoSoValue bitcoin ETF cumulative net inflows. The 11 funds had pulled in a combined $3.29 billion in net inflows through March and April alone before this reversal.
That momentum flipped hard. Five consecutive trading days of net redemptions added up to $1.26 billion leaving the funds. Total cumulative net inflows since the January 2024 ETF debut dropped from $59.76 billion to $58.5 billion in a week, a meaningful reversal for funds that many analysts had held up as proof institutional demand for bitcoin was structural and durable.
The trigger appears tied to macro. Analysts have pointed to resurgent inflation fears in the U.S. as the driver behind bitcoin’s sudden weakness. Oddly, those same inflation fears barely dented equity markets. The Nasdaq and S&P 500 both hit fresh all-time highs on May 13, even as bitcoin slid. That split tells a story about how investors are currently using these ETFs, more as a risk-on satellite position than as a true inflation hedge.
Bitcoin Price Stalls at the 200-Day Moving Average
Bitcoin’s recent run was impressive on paper. Prices climbed from $65,000 to above $80,000, a gain of more than 23% that bulls were quick to credit partly to ETF inflows. That rally is now stuck. The upswing has run out of fuel near the 200-day simple moving average, a level positioned just above $82,000, and bitcoin’s 200-day moving average resistance at $82,000 has turned into a ceiling rather than a floor.
In the 24 hours to May 14, bitcoin dropped over 2% to $79,400. That is not a catastrophic decline on its own. But combined with the ETF outflow data and the macro backdrop, the chart now looks less like a consolidation and more like a distribution phase, the part of a market cycle where early buyers hand shares to later arrivals at elevated prices.
The 200-day moving average is watched closely by institutional desks as a trend dividing line. A sustained close below that level would shift many momentum models from bullish to neutral or bearish. Bitcoin has not had a clean breakout above it in this cycle, each approach has so far been rejected. That pattern is worth watching.
Do ETF Flows Still Drive Bitcoin Price?
Here is where the analysis gets complicated. The instinct is to draw a straight line from ETF outflows to bitcoin price drops. Historically through 2024, that line held reasonably well. Today it is shakier. A 90-day rolling Pearson correlation coefficient between bitcoin’s daily percentage return and the daily percentage change in cumulative net ETF inflows currently sits at just 0.16, a number statistically indistinguishable from zero.
For comparison, that same correlation coefficient peaked at 0.68 in February. A reading of 0.68 means there was a real, measurable relationship between inflow direction and price direction. At 0.16, there is effectively none. In plain terms: knowing whether ETFs saw net buying or net selling on any given day tells you almost nothing about where bitcoin closed that day.
That statistical reality should temper the panic. But it does not mean the $635 million outflow is noise. Large single-day redemptions still matter for liquidity and sentiment. When a fund bleeds at this scale, authorized participants are redeeming baskets, which means selling pressure somewhere in the chain, even if the correlation coefficient says the relationship is weak on average.
Adam Haeems, head of asset management at Tesseract Group, framed the real risk differently. His firm manages over $500 million in assets, and his view is that flows alone are not the story. The macro regime is.
A persistently hot CPI, an incoming Fed under Warsh that markets read as more hawkish, or another oil shock can compress bitcoin even with positive net flows. From our perspective, the more useful question is not whether the markup leg continues, but whether macro conditions stay loose enough for the flows to do their work.
Why This Outflow Matters More Than the Correlation Data Suggests
The low correlation coefficient is real. But context matters. ETF inflows through March and April were loudly celebrated as bullish catalysts by analysts, media, and crypto Twitter alike. They were treated as proof that institutional demand was absorbing supply. Now that those inflows have reversed, the same logic applies in the other direction, even if the math says the relationship is weak.
That is the asymmetry bulls need to reckon with. If inflows were given credit for pushing bitcoin above $80,000, then outflows deserve scrutiny when bitcoin falls back below that level. You cannot have it both ways. The bitcoin spot ETF $635 million single-day outflow data from Farside Investors shows five days of consecutive net redemptions, not a one-off event but a trend.
The macro picture Haeems described compounds the issue. A Fed perceived as more hawkish under Kevin Warsh, persistent CPI readings above target, and the possibility of an oil shock are not hypothetical tail risks right now. They are live conversations in bond markets. Bitcoin has historically underperformed when real interest rates rise, because the asset pays no yield and competes with risk-free alternatives that suddenly pay more.
What changes the picture? Either the macro loosens, inflation rolls over, the Fed pivots, risk appetite returns, or a new demand catalyst emerges that does not depend on ETF flows. Neither of those things is guaranteed by the calendar. Investors holding bitcoin ETF shares right now are essentially making a bet that macro conditions stay accommodative enough for the demand side to reassert itself. That is not an unreasonable bet. But after a week of $1.26 billion in outflows and a price that cannot clear $82,000, it is a bet that needs more supporting evidence than it had a month ago.
The total cumulative net inflows figure of $58.5 billion is still substantial. These funds have not been abandoned. But the margin of confidence that carried the narrative through April is thinner now, and a single bad CPI print or a hawkish Fed statement could test how durable that institutional demand really is.
Frequently Asked Questions
What caused the $635 million bitcoin spot ETF outflow on May 13?
Investors pulled $635 million from the 11 U.S.-listed spot bitcoin ETFs on May 13, the largest single-day outflow since January 29, 2026. Analysts linked the redemptions to resurgent U.S. inflation fears and concern that the Federal Reserve under Kevin Warsh would adopt a more hawkish stance, compressing risk assets like bitcoin.
How much money has left bitcoin spot ETFs in the past week?
Five consecutive trading days of net redemptions drained a combined $1.26 billion from U.S. spot bitcoin ETFs. Total cumulative net inflows since the January 2024 launch dropped from $59.76 billion to $58.5 billion, according to SoSoValue data, reversing roughly one week of the prior months’ gains.
Does the bitcoin ETF outflow mean the price will keep falling?
Not automatically. The 90-day rolling Pearson correlation between ETF flows and bitcoin’s daily return currently sits at just 0.16, which is statistically near zero. That means daily flow direction has little predictive power over daily price. Macro conditions, inflation data, Fed tone, and risk appetite, appear to be the bigger driver right now.
What is the bitcoin 200-day moving average and why does it matter?
The 200-day simple moving average is a widely tracked technical level that institutional traders use to judge long-term trend direction. Bitcoin’s rally from $65,000 stalled just above $82,000, where the 200-day average sits. A sustained close below that level would shift momentum signals from bullish to neutral for many trading desks.
This article is for informational purposes only and does not constitute investment advice. Every investment and trading decision involves risk. Readers should conduct their own research before making any financial decisions.


















The $635M figure is striking but the real tell is it being the biggest redemption since January 29. Curious whether that was concentrated in one issuer like IBIT or spread across the board. Single-day numbers without a per-fund breakdown only say so much.
Outflows hitting $635 million sounds dramatic until you remember these ETFs pulled in tens of billions over the past year. One bad day at $79,400 does not undo that. What the piece skips is whether this is panic selling or just rebalancing into quarter end. Headlines love a redemption number, context less so.
honestly $79,400 is a gift if you have dry powder. the January 29 selloff bounced back within weeks and I don’t see why this is different. been waiting on a dip like this for a while.
635 million out the door in a single session, brutal.
Seen this movie before. The 2021 pullbacks had far scarier single-day moves, the ETF wrapper just makes the flows visible now. Anyone tracking whether the outflows kept going on the 14th or if it was a one-off?